Finds local maxima in sequential data.
Usage
peaks_find(x, y, ...)

# S4 method for class 'numeric,numeric'
peaks_find(x, y, method = "MAD", SNR = 2, m = NULL, ...)

# S4 method for class 'ANY,missing'
peaks_find(x, method = "MAD", SNR = 2, m = NULL, ...)
Arguments
- x, y
A
numericvector. Ifyis missing, an attempt is made to interpretxin a suitable way (seegrDevices::xy.coords()).- ...
Extra parameters to be passed to internal methods.
- method
A
characterstring specifying the method to be used for background noise estimation (see below).- SNR
An
integergiving the signal-to-noise-ratio for peak detection (see below).- m
An odd
integergiving the window size (i.e. the number of adjacent points to be used). IfNULL, 5% of the data points is used as the half window size.
Value
Returns a list with two components x and y.
Details
A local maximum has to be the highest one in the given window and has to be higher than \(SNR \times noise\) to be recognized as peak.
The following methods are available for noise estimation:
MADMedian Absolute Deviation.
Note that to improve peak detection, it may be helpful to smooth the data and remove the baseline beforehand.
Note
There will be \((m - 1) / 2\) points both at the beginning and at the end of the data series for which a complete \(m\)-width window cannot be obtained. To prevent data loss, progressively wider/narrower windows are used at both ends of the data series.
Adapted from Stasia Grinberg's
findPeaks function.
See also
Other peaks detection methods:
peaks_fwhm()
Examples
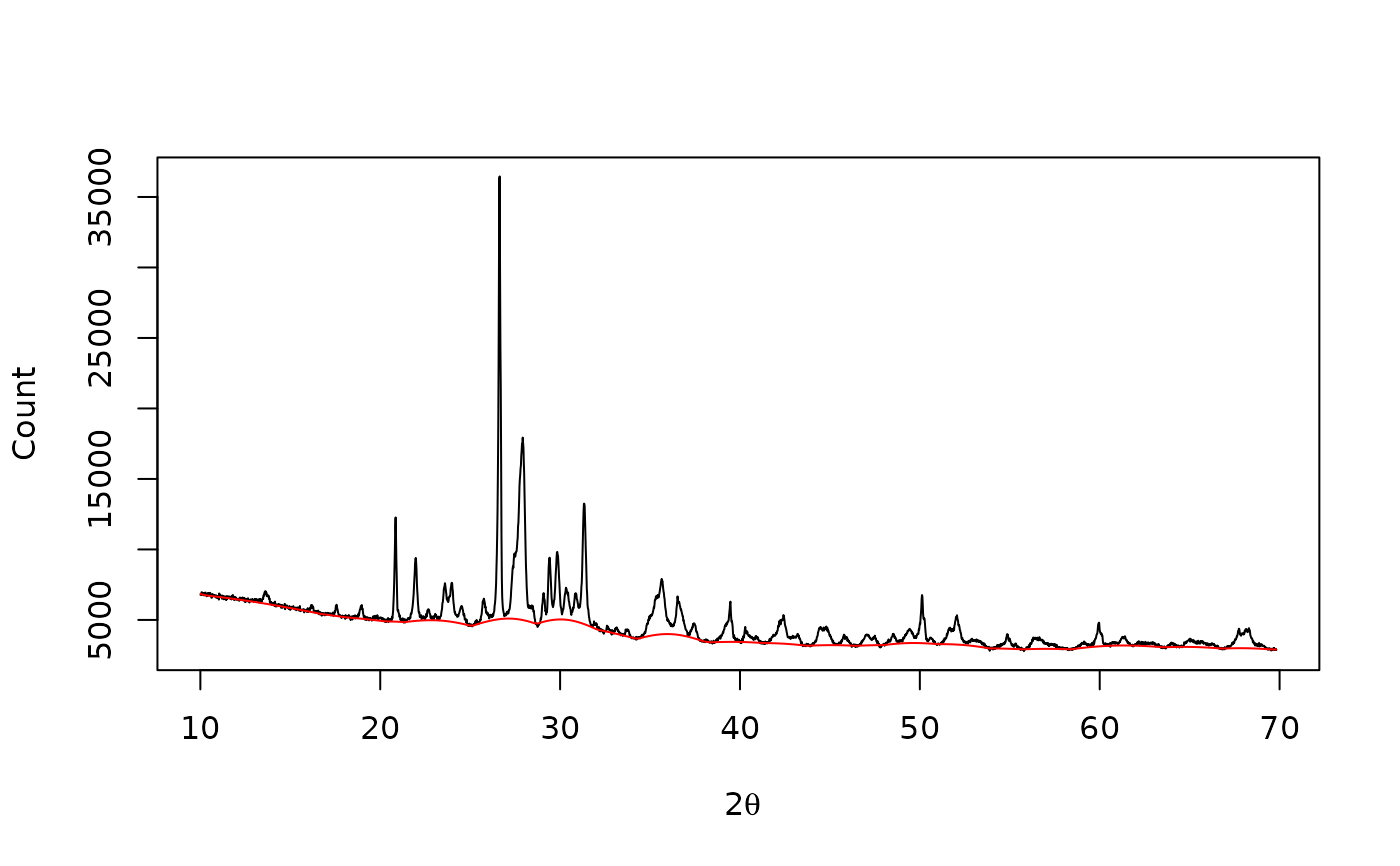
## X-ray diffraction
data("XRD")
## 4S Peak Filling baseline
baseline <- baseline_peakfilling(XRD, n = 10, m = 5, by = 10, sparse = TRUE)
plot(XRD, type = "l", xlab = expression(2*theta), ylab = "Count")
lines(baseline, type = "l", col = "red")
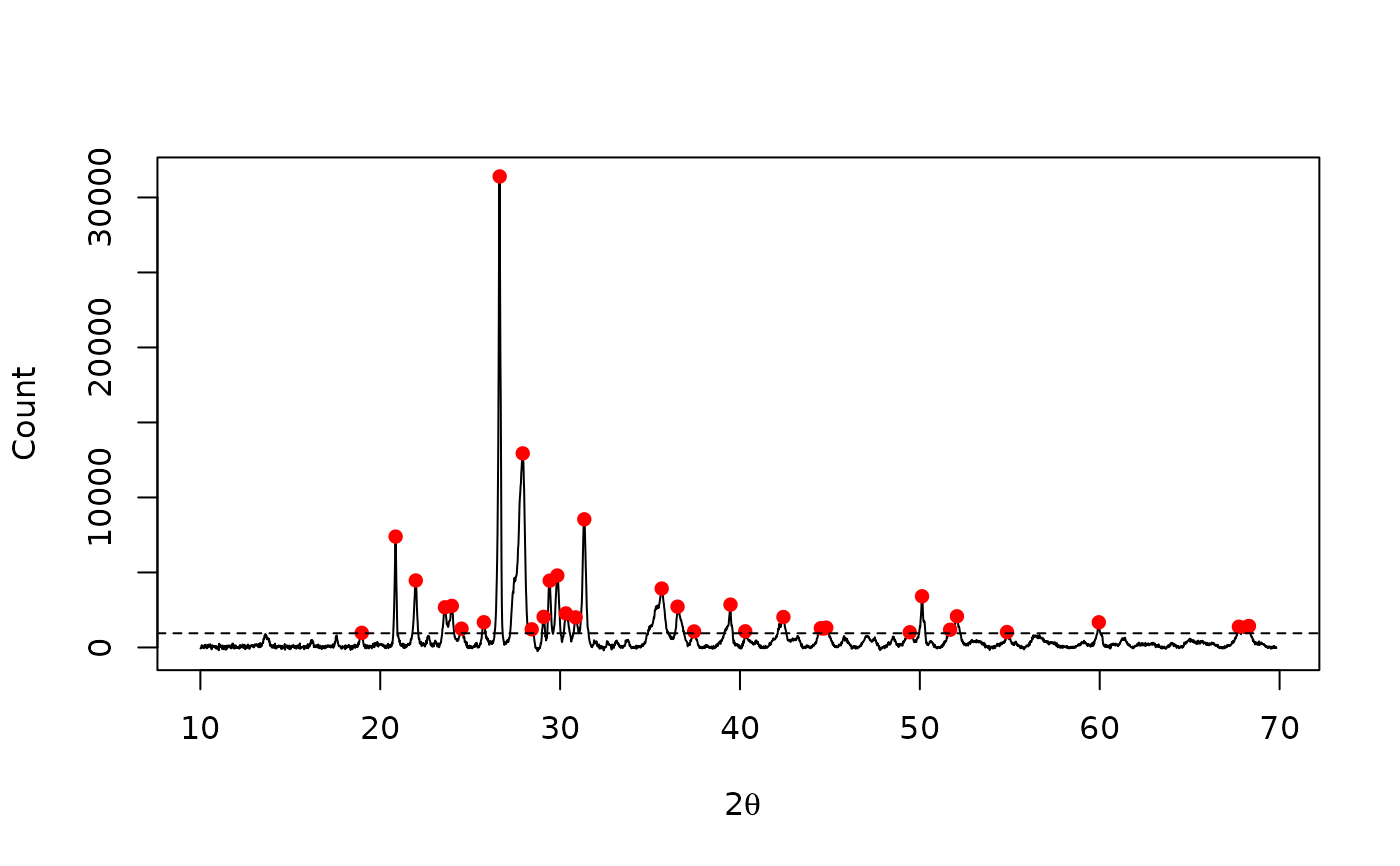
 ## Correct baseline
XRD <- signal_drift(XRD, lag = baseline, subtract = TRUE)
## Find peaks
peaks <- peaks_find(XRD, SNR = 3, m = 11)
plot(XRD, type = "l", xlab = expression(2*theta), ylab = "Count")
lines(peaks, type = "p", pch = 16, col = "red")
abline(h = attr(peaks, "noise"), lty = 2) # noise threshold
## Correct baseline
XRD <- signal_drift(XRD, lag = baseline, subtract = TRUE)
## Find peaks
peaks <- peaks_find(XRD, SNR = 3, m = 11)
plot(XRD, type = "l", xlab = expression(2*theta), ylab = "Count")
lines(peaks, type = "p", pch = 16, col = "red")
abline(h = attr(peaks, "noise"), lty = 2) # noise threshold
 ## Half-Width at Half-Maximum
x <- seq(-4, 4, length = 1000)
y <- dnorm(x)
peaks_fwhm(x, y, center = 0) # Expected: 2 * sqrt(2 * log(2))
#> [1] 2.354354
## Half-Width at Half-Maximum
x <- seq(-4, 4, length = 1000)
y <- dnorm(x)
peaks_fwhm(x, y, center = 0) # Expected: 2 * sqrt(2 * log(2))
#> [1] 2.354354