Averages x values and applies a function to the corresponding y values.
Usage
resample_bin(x, y, ...)

# S4 method for class 'numeric,numeric'
resample_bin(x, y, by, f = mean, ...)

# S4 method for class 'ANY,missing'
resample_bin(x, y, by, f = sum)
Arguments
- x, y
A
numericvector. Ifyis missing, an attempt is made to interpretxin a suitable way (seegrDevices::xy.coords()).- ...
Extra parameters to be passed to
f.- by
An
integerspecifying the binning ratio (i.e. the number of points to be grouped together; seewindow_tumbling()).- f
A
functionthat takes anumericvector of intensities as argument and returns a singlenumericvector. Used to estimate the local representative value in each bin (defaults tosum(); see examples).
Value
Returns a list with two components x and y.
See also
Other resampling methods:
resample_down(),
resample_interpolate()
Examples
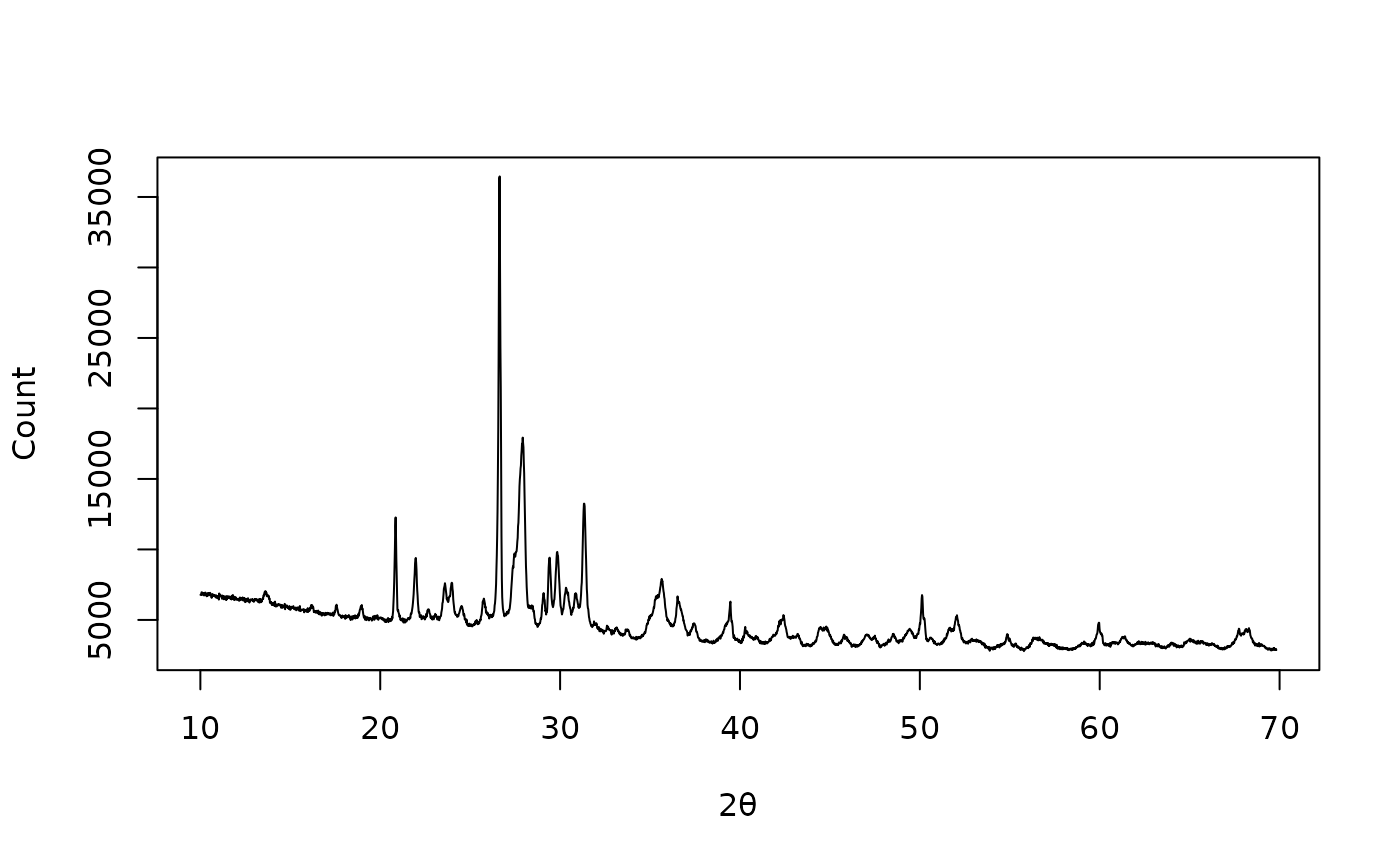
## X-ray diffraction
data("XRD")
## Plot spectrum
plot(XRD, type = "l", xlab = expression(2*theta), ylab = "Count")
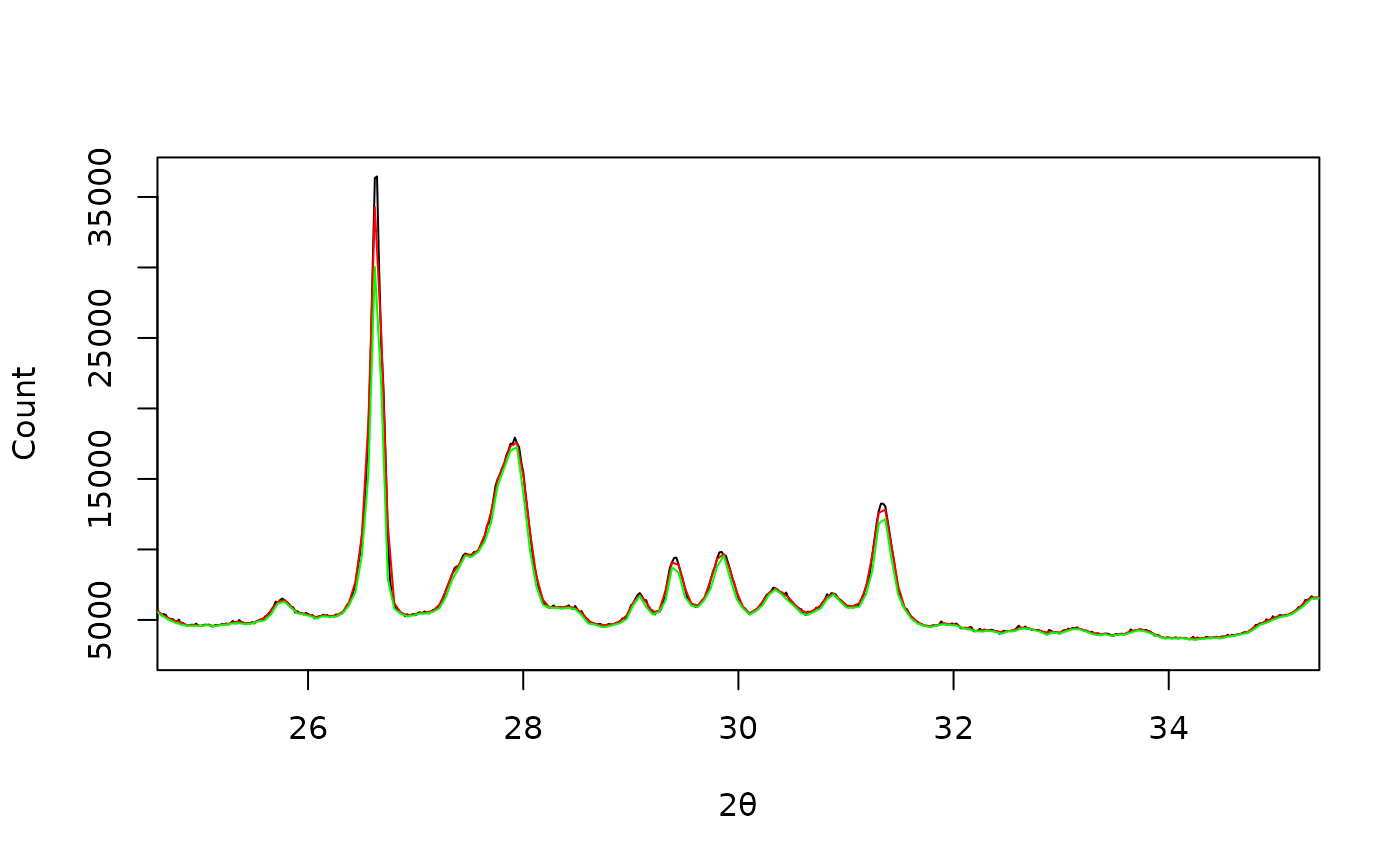
 ## Bin by 3
XRD_bin_mean <- resample_bin(XRD, by = 3, f = mean)
XRD_bin_min <- resample_bin(XRD, by = 3, f = min)
plot(XRD, type = "l", xlim = c(25, 35),
xlab = expression(2*theta), ylab = "Count")
lines(XRD_bin_mean, type = "l", col = "red")
lines(XRD_bin_min, type = "l", col = "green")
## Bin by 3
XRD_bin_mean <- resample_bin(XRD, by = 3, f = mean)
XRD_bin_min <- resample_bin(XRD, by = 3, f = min)
plot(XRD, type = "l", xlim = c(25, 35),
xlab = expression(2*theta), ylab = "Count")
lines(XRD_bin_mean, type = "l", col = "red")
lines(XRD_bin_min, type = "l", col = "green")
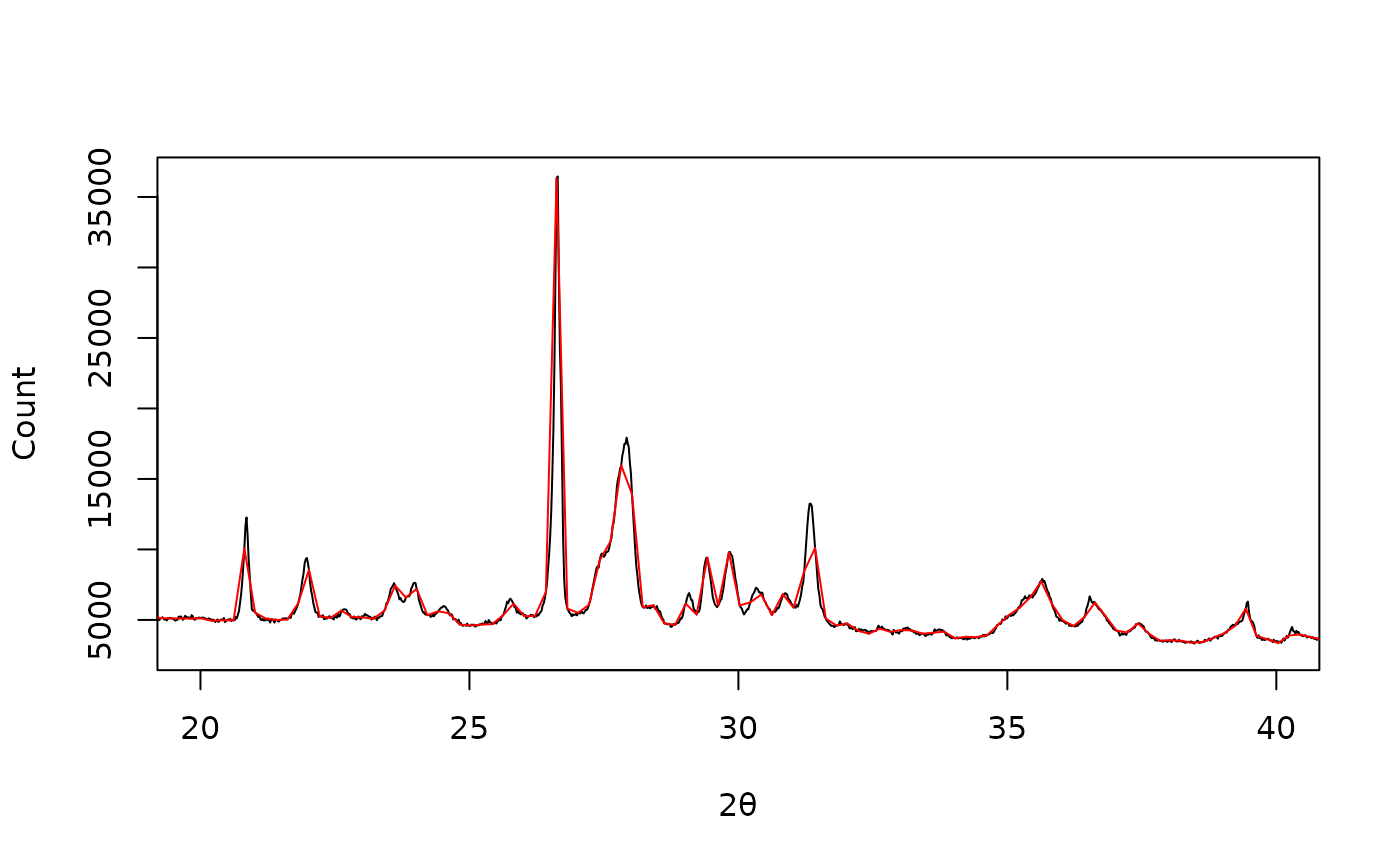
 ## Downsample by 10
XRD_down <- resample_down(XRD, by = 10)
plot(XRD, type = "l", xlim = c(20, 40),
xlab = expression(2*theta), ylab = "Count")
lines(XRD_down, type = "l", col = "red")
## Downsample by 10
XRD_down <- resample_down(XRD, by = 10)
plot(XRD, type = "l", xlim = c(20, 40),
xlab = expression(2*theta), ylab = "Count")
lines(XRD_down, type = "l", col = "red")
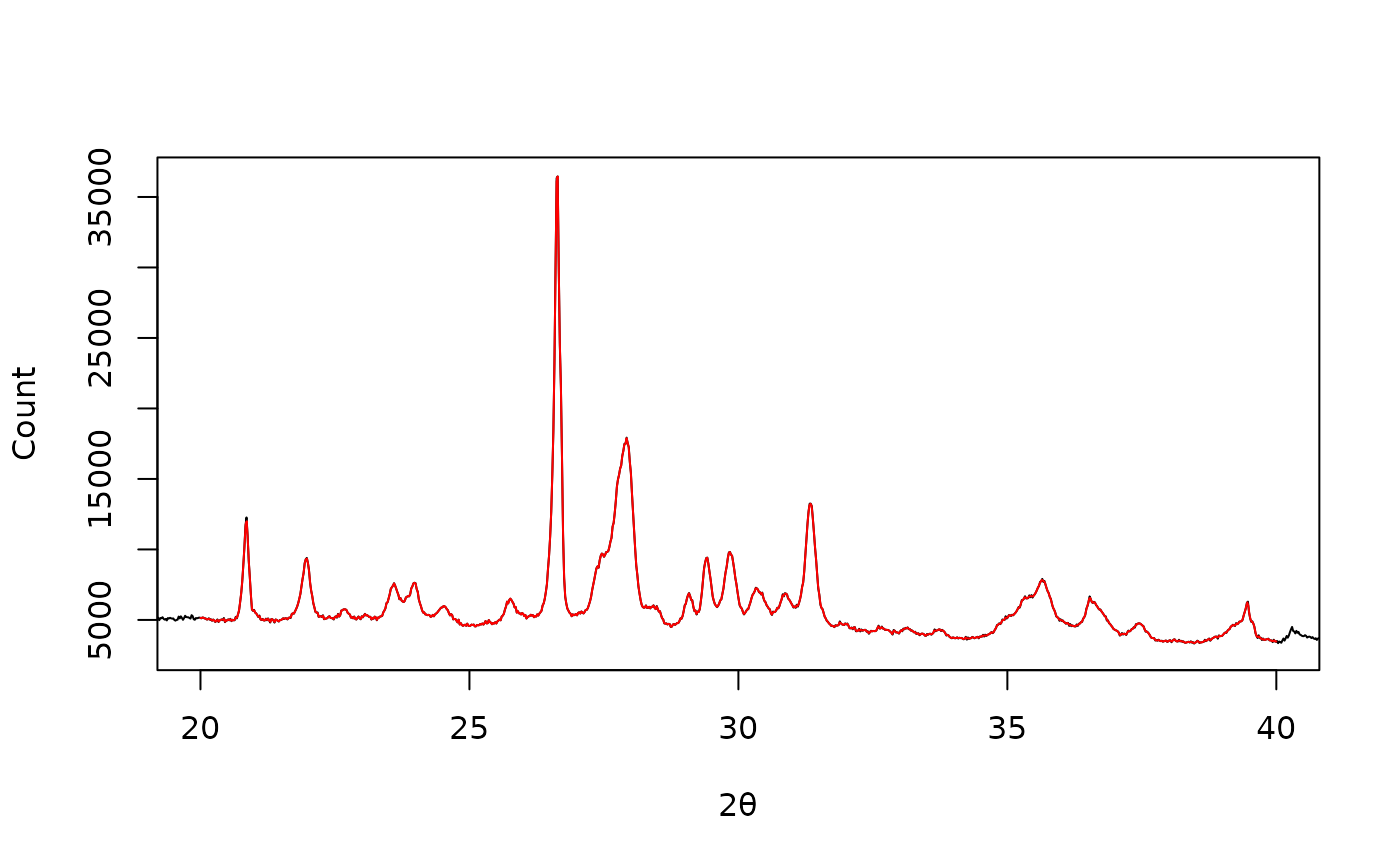
 ## Linearly interpolate
XRD_approx <- resample_interpolate(XRD, from = 20, to = 40, by = 0.02)
plot(XRD, type = "l", xlim = c(20, 40),
xlab = expression(2*theta), ylab = "Count")
lines(XRD_approx, type = "l", col = "red")
## Linearly interpolate
XRD_approx <- resample_interpolate(XRD, from = 20, to = 40, by = 0.02)
plot(XRD, type = "l", xlim = c(20, 40),
xlab = expression(2*theta), ylab = "Count")
lines(XRD_approx, type = "l", col = "red")