Provides a color scheme that map a numeric vector to colors.
Value
A palette function with argument a vector of values that are mapped to
colors. The data midpoint can be specified with an additional midpoint
argument (see examples).
See also
Other color palettes:
colour(),
info(),
scale_picker
Examples
## Visualize a simple DEM model
## Distribution of elevation values
elevation <- hist(volcano)
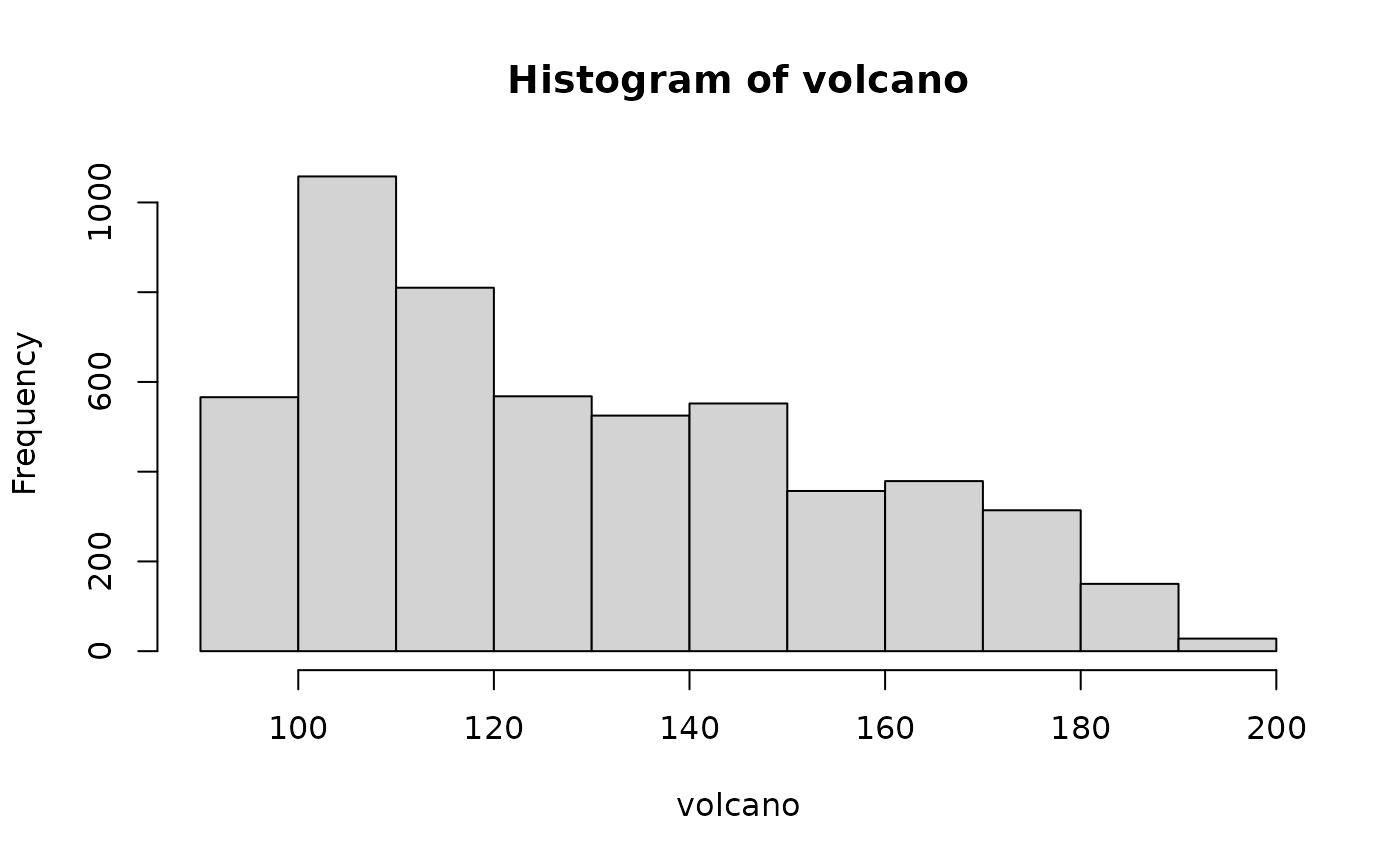 ## Where are breaks?
elevation$breaks
#> [1] 90 100 110 120 130 140 150 160 170 180 190 200
## Build palette function
ramp_BuRd <- ramp(palette = "BuRd")
(col <- ramp_BuRd(elevation$breaks))
#> [1] "#2166AC" "#3986BC" "#66A9CF" "#9CCAE1" "#CAE1EE" "#E8F0F4" "#F9ECE4"
#> [8] "#FCD5C0" "#F5AE8D" "#E37E64" "#CC4C43" "#B2182B"
#> attr(,"breaks")
#> [1] 90 100 110 120 130 140 150 160 170 180 190 200
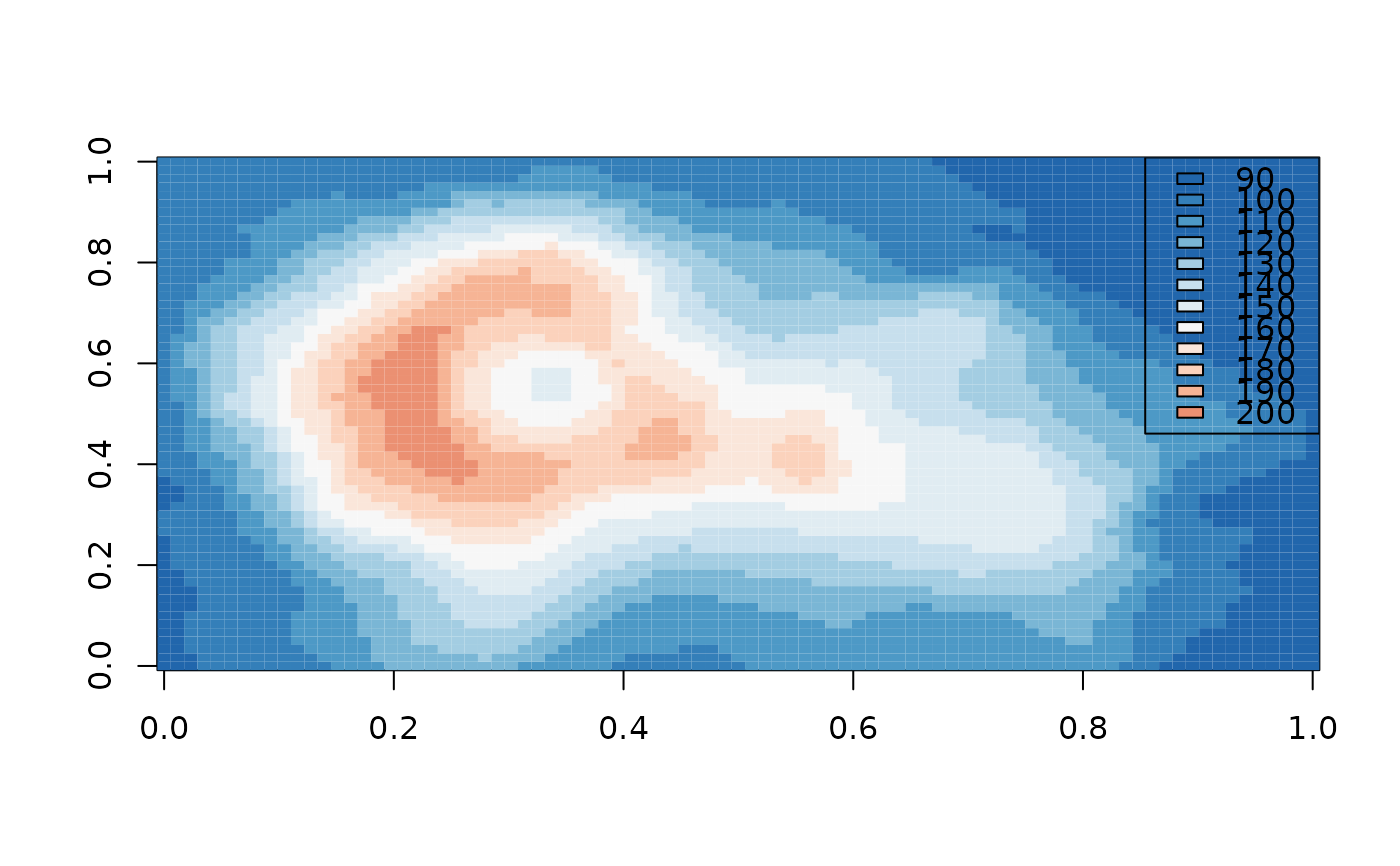
image(volcano, col = col)
legend("topright", legend = attr(col, "breaks"), fill = col)
## Where are breaks?
elevation$breaks
#> [1] 90 100 110 120 130 140 150 160 170 180 190 200
## Build palette function
ramp_BuRd <- ramp(palette = "BuRd")
(col <- ramp_BuRd(elevation$breaks))
#> [1] "#2166AC" "#3986BC" "#66A9CF" "#9CCAE1" "#CAE1EE" "#E8F0F4" "#F9ECE4"
#> [8] "#FCD5C0" "#F5AE8D" "#E37E64" "#CC4C43" "#B2182B"
#> attr(,"breaks")
#> [1] 90 100 110 120 130 140 150 160 170 180 190 200
image(volcano, col = col)
legend("topright", legend = attr(col, "breaks"), fill = col)
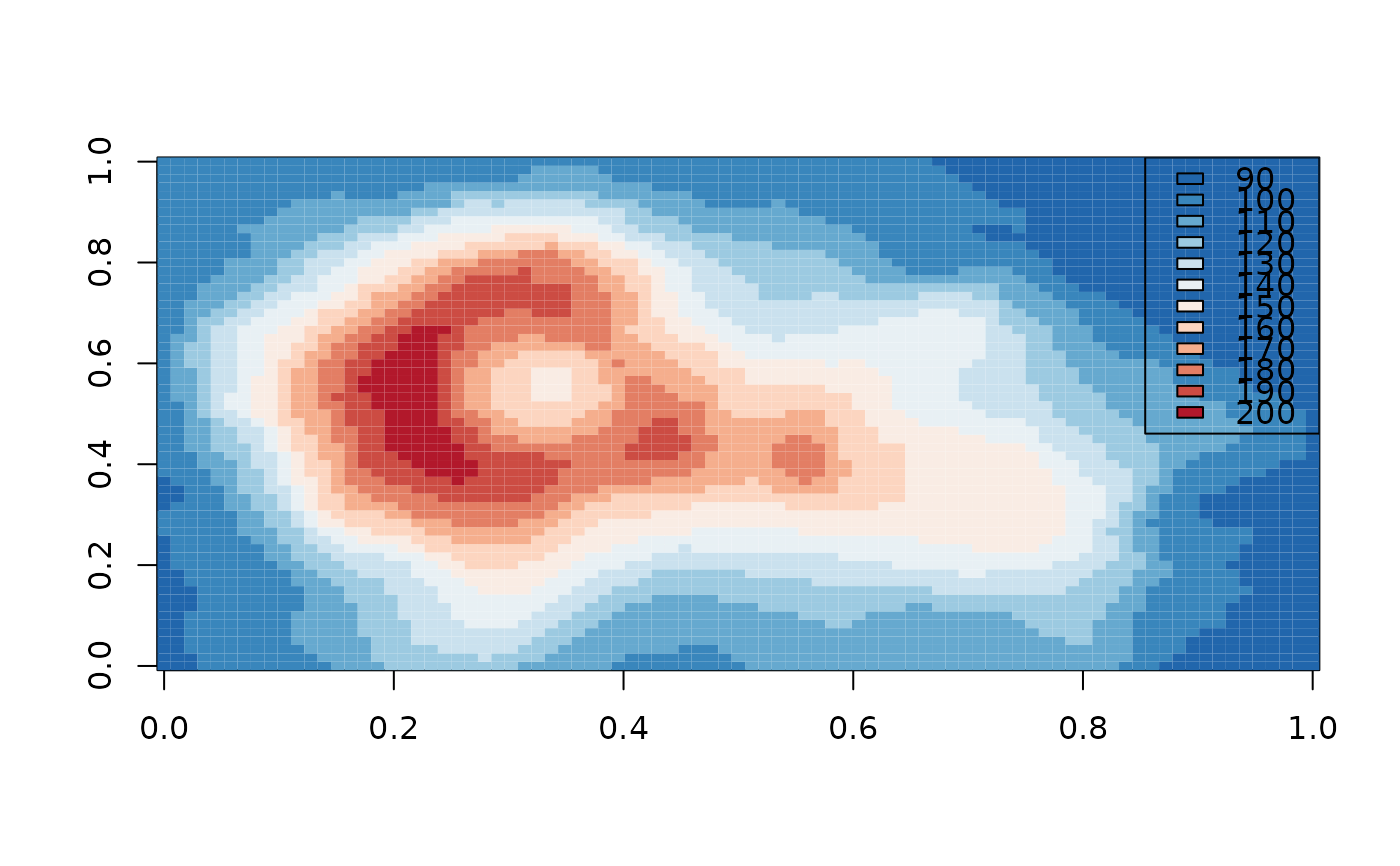 ## Rescale to midpoint
(col <- ramp_BuRd(elevation$breaks, midpoint = 160))
#> [1] "#2166AC" "#347FB9" "#4D99C6" "#7AB6D5" "#A3CDE2" "#C7DFED" "#E0ECF2"
#> [8] "#F7F7F7" "#FAE6DA" "#FBD2BC" "#F6B495" "#EB9072"
#> attr(,"breaks")
#> [1] 90 100 110 120 130 140 150 160 170 180 190 200
image(volcano, col = col)
legend("topright", legend = attr(col, "breaks"), fill = col)
## Rescale to midpoint
(col <- ramp_BuRd(elevation$breaks, midpoint = 160))
#> [1] "#2166AC" "#347FB9" "#4D99C6" "#7AB6D5" "#A3CDE2" "#C7DFED" "#E0ECF2"
#> [8] "#F7F7F7" "#FAE6DA" "#FBD2BC" "#F6B495" "#EB9072"
#> attr(,"breaks")
#> [1] 90 100 110 120 130 140 150 160 170 180 190 200
image(volcano, col = col)
legend("topright", legend = attr(col, "breaks"), fill = col)