Plot Outliers
Arguments
- x
An
OutlierIndexobject.- ...
Further graphical parameters.
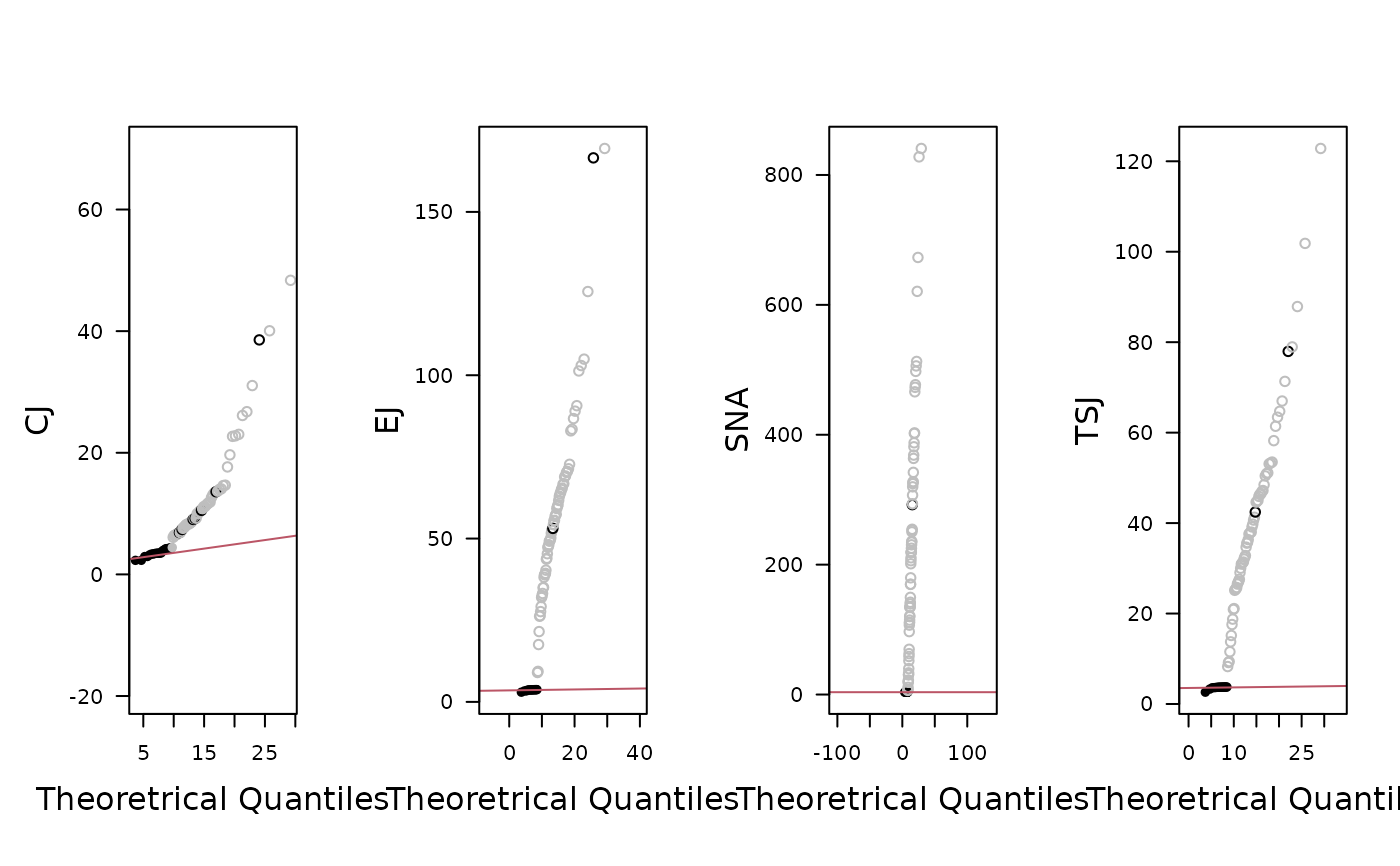
A
logicalscalar: should a quantile-quantile plot be produced?- probs
A length-two
numericvector representing probabilities. Corresponding quantile pairs define the line drawn (seestats::qqline()). Only used ifqqisTRUE.- ncol
An
integerspecifying the number of columns to use whenfacetis "multiple". Defaults to 1 for up to 4 series, otherwise to 2.- flip
A
logicalscalar: should the y-axis (ticks and numbering) be flipped from side 2 (left) to 4 (right) from group to group?- xlab, ylab
A
charactervector giving the x and y axis labels.- main
A
characterstring giving a main title for the plot.- sub
A
characterstring giving a subtitle for the plot.- ann
A
logicalscalar: should the default annotation (title and x and y axis labels) appear on the plot?- axes
A
logicalscalar: should axes be drawn on the plot?- frame.plot
A
logicalscalar: should a box be drawn around the plot?- panel.first
An an
expressionto be evaluated after the plot axes are set up but before any plotting takes place. This can be useful for drawing background grids.- panel.last
An
expressionto be evaluated after plotting has taken place but before the axes, title and box are added.
Value
plot() is called for its side-effects: is results in a graphic being
displayed (invisibly return x).
References
Filzmoser, P., Garrett, R. G. & Reimann, C. (2005). Multivariate outlier detection in exploration geochemistry. Computers & Geosciences, 31(5), 579-587. doi:10.1016/j.cageo.2004.11.013 .
Filzmoser, P. & Hron, K. (2008). Outlier Detection for Compositional Data Using Robust Methods. Mathematical Geosciences, 40(3), 233-248. doi:10.1007/s11004-007-9141-5 .
Filzmoser, P., Hron, K. & Reimann, C. (2012). Interpretation of multivariate outliers for compositional data. Computers & Geosciences, 39, 77-85. doi:10.1016/j.cageo.2011.06.014 .
See also
Other outlier detection methods:
outliers()
Examples
## Data from Day et al. 2011
data("kommos", package = "folio") # Coerce to compositional data
kommos <- remove_NA(kommos, margin = 1) # Remove cases with missing values
coda <- as_composition(kommos, groups = 1) # Use ceramic types for grouping
#> 1 qualitative variable was removed: date.
## Detect outliers
out <- outliers(coda, groups = NULL, robust = FALSE)
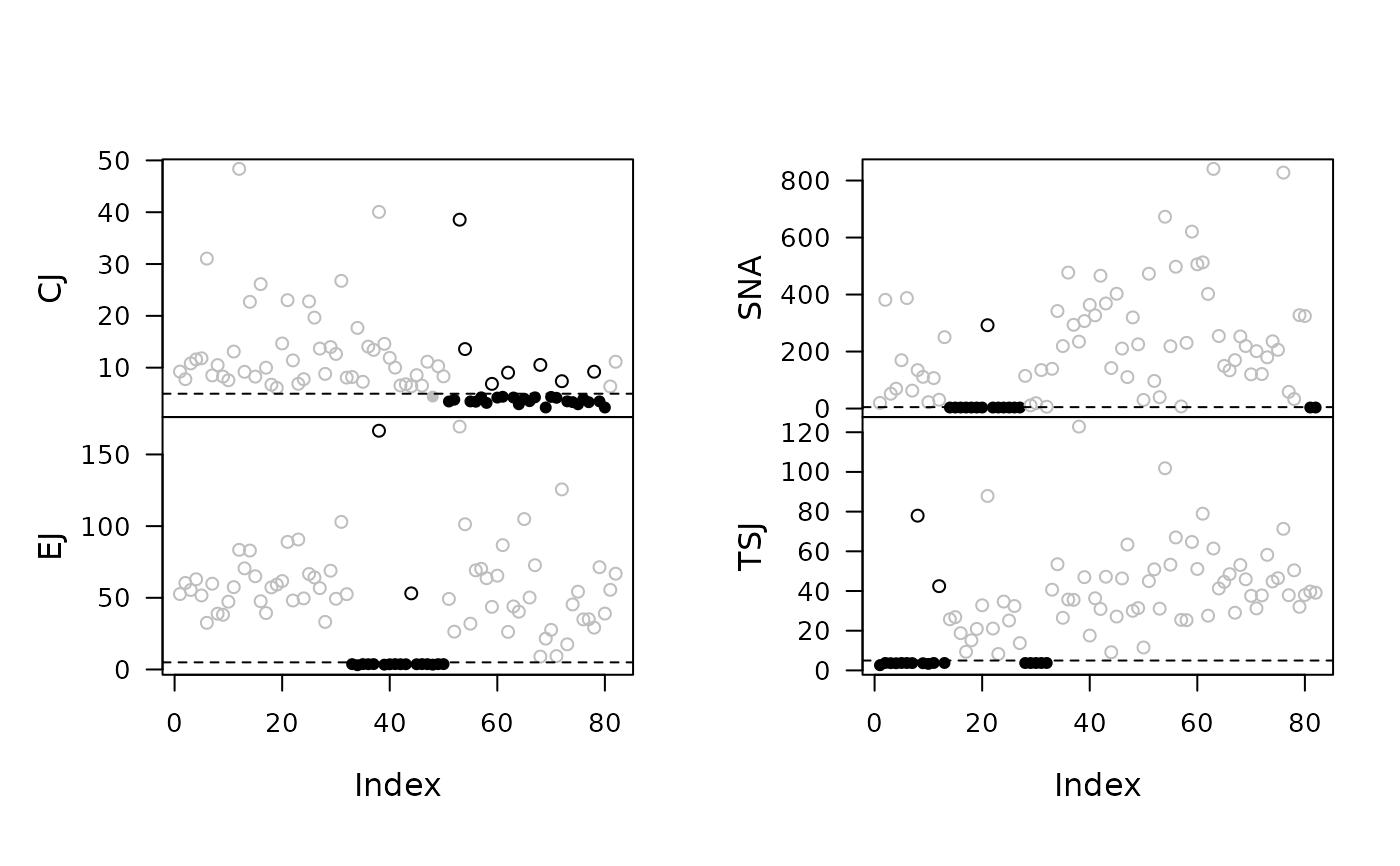
plot(out) # Plot
 plot(out, qq = TRUE) # Quantile-Quantile plot
 ## Detect outliers by group
out <- outliers(coda[, 1:15, drop = FALSE])
plot(out, ncol = 2) # Plot
## Detect outliers by group
out <- outliers(coda[, 1:15, drop = FALSE])
plot(out, ncol = 2) # Plot
 plot(out, qq = TRUE, ncol = 4) # Quantile-Quantile plot