Highest Density Regions
Arguments
- x
A
CalibratedAgesobject.- level
A length-one
numericvector giving the confidence level.- ...
Currently not used.
Value
A CalibratedIntervals object.
References
Hyndman, R. J. (1996). Computing and graphing highest density regions. American Statistician, 50: 120-126. doi:10.2307/2684423 .
See also
stats::density(), arkhe::interval_hdr()
Other statistics:
interval_credible,
mean(),
median(),
quantile(),
radialplot()
Examples
## Calibrate multiple dates
cal <- c14_calibrate(
values = c(5000, 4500),
errors = c(45, 35),
names = c("X", "Y")
)
## HDR
hdr68 <- interval_hdr(cal, level = 0.683)
hdr95 <- interval_hdr(cal, level = 0.954)
hdr99 <- interval_hdr(cal, level = 0.997)
## Coerce to a data.frame
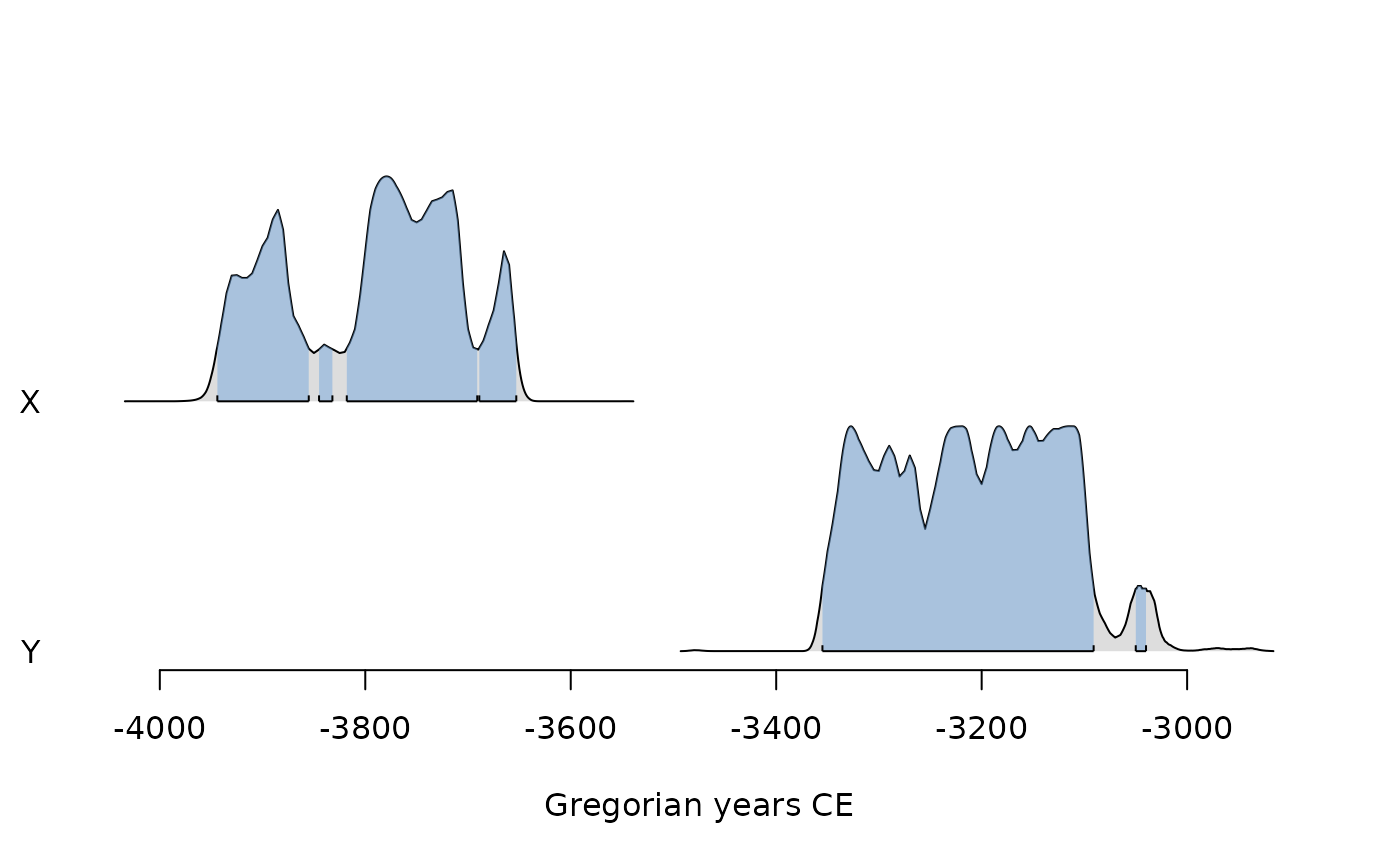
as.data.frame(hdr95, calendar = BC())
#> label start end p
#> 1 X 3944 3855 0.29
#> 2 X 3845 3832 0.02
#> 3 X 3818 3691 0.56
#> 4 X 3689 3653 0.09
#> 5 Y 3355 3091 0.94
#> 6 Y 3050 3040 0.01
## Coerce to a list
as.list(hdr95)
#> $X
#> start end p
#> 1 -3944 -3855 0.29
#> 2 -3845 -3832 0.02
#> 3 -3818 -3691 0.56
#> 4 -3689 -3653 0.09
#>
#> $Y
#> start end p
#> 5 -3355 -3091 0.94
#> 6 -3050 -3040 0.01
#>
## Plot
plot(hdr95, lwd = 3)