Plot Time Series and Time Intervals
Usage
# S4 method for class 'TimeIntervals,missing'
plot(
  x,
  calendar = get_calendar(),
  groups = NULL,
  sort = TRUE,
  decreasing = FALSE,
  xlab = NULL,
  ylab = NULL,
  main = NULL,
  sub = NULL,
  ann = graphics::par("ann"),
  axes = TRUE,
  frame.plot = axes,
  panel.first = NULL,
  panel.last = NULL,
  ...
)

# S4 method for class 'TimeSeries,missing'
plot(
  x,
  facet = c("multiple", "single"),
  calendar = get_calendar(),
  panel = graphics::lines,
  flip = FALSE,
  ncol = NULL,
  xlab = NULL,
  ylab = NULL,
  main = NULL,
  sub = NULL,
  ann = graphics::par("ann"),
  axes = TRUE,
  frame.plot = axes,
  panel.first = NULL,
  panel.last = NULL,
  ...
)
Arguments
- x
A
TimeSeriesor aTimeIntervalsobject.- calendar
A
TimeScaleobject specifying the target calendar (seecalendar()).- groups
A
charactervector specifying the group each interval belongs to.- sort
A
logicalscalar: should the data be sorted in chronological order?- decreasing
A
logicalscalar: should the sort order be decreasing? Only used ifsortisTRUE.- xlab, ylab
A
charactervector giving the x and y axis labels.- main
A
characterstring giving a main title for the plot.- sub
A
characterstring giving a subtitle for the plot.- ann
A
logicalscalar: should the default annotation (title and x and y axis labels) appear on the plot?- axes
A
logicalscalar: should axes be drawn on the plot?- frame.plot
A
logicalscalar: should a box be drawn around the plot?- panel.first
An
expressionto be evaluated after the plot axes are set up but before any plotting takes place. This can be useful for drawing background grids.- panel.last
An
expressionto be evaluated after plotting has taken place but before the axes, title and box are added.- ...
Further parameters to be passed to
panel(e.g. graphical parameters).- facet
A
characterstring specifying whether the series should be plotted separately (with a common time axis) or on a single plot? It must be one of "multiple" or "single". Any unambiguous substring can be given.- panel
A
functionin the formfunction(x, y, ...)which gives the action to be carried out in each panel of the display. The default isgraphics::lines().- flip
A
logicalscalar: should the y-axis (ticks and numbering) be flipped from side 2 (left) to 4 (right) from series to series whenfacetis "multiple"?- ncol
An
integerspecifying the number of columns to use whenfacetis "multiple". Defaults to 1 for up to 4 series, otherwise to 2.
Value
plot() is called for its side-effects: it results in a graphic
being displayed. Invisibly returns x.
See also
Other plotting tools:
image(),
year_axis()
Examples
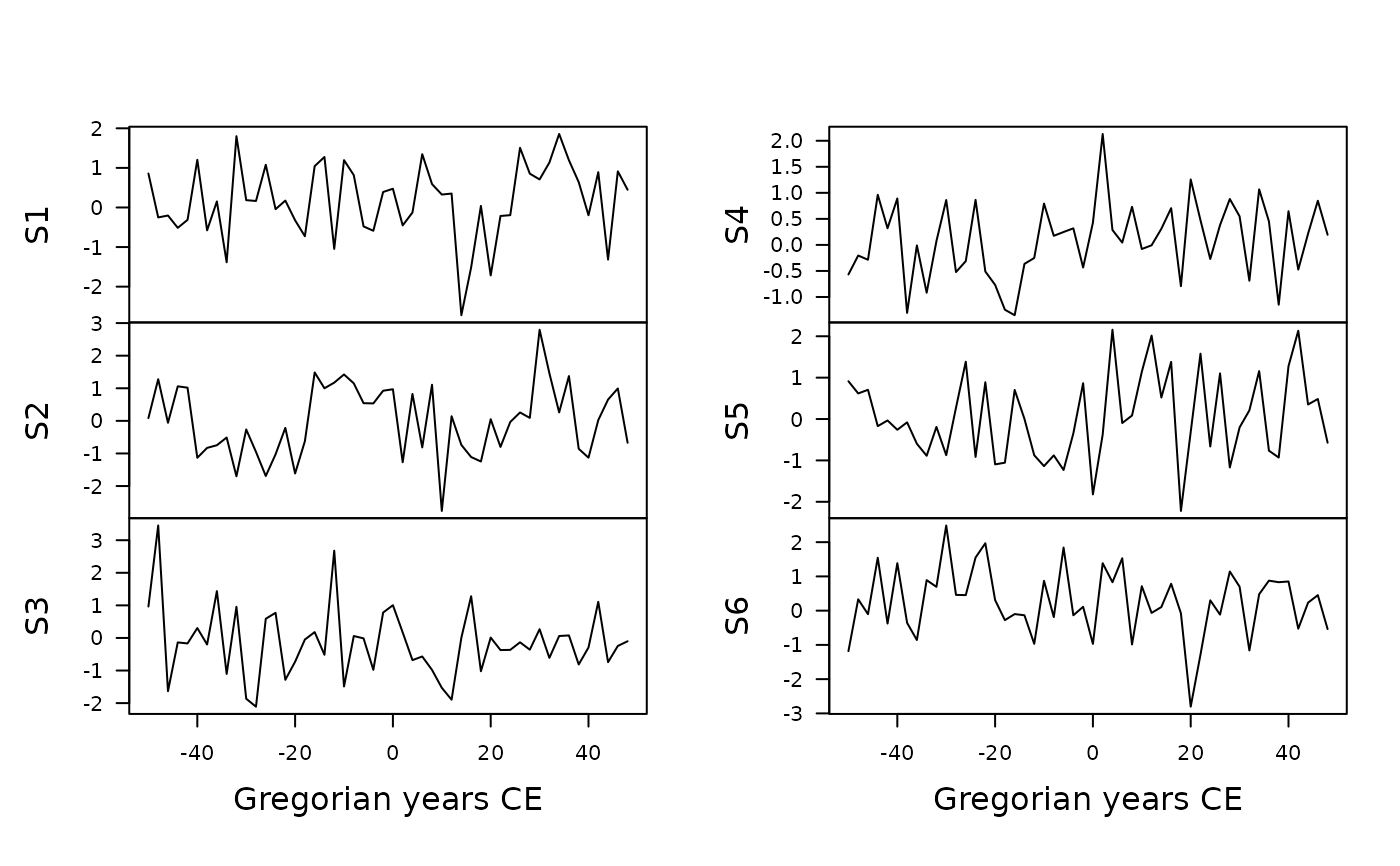
## Create 6 time-series of 50 observations
## Sampled every two years starting from 2000 BP
X <- series(
object = matrix(rnorm(300), nrow = 50, ncol = 6),
time = seq(2000, by = -2, length.out = 50),
calendar = BP()
)
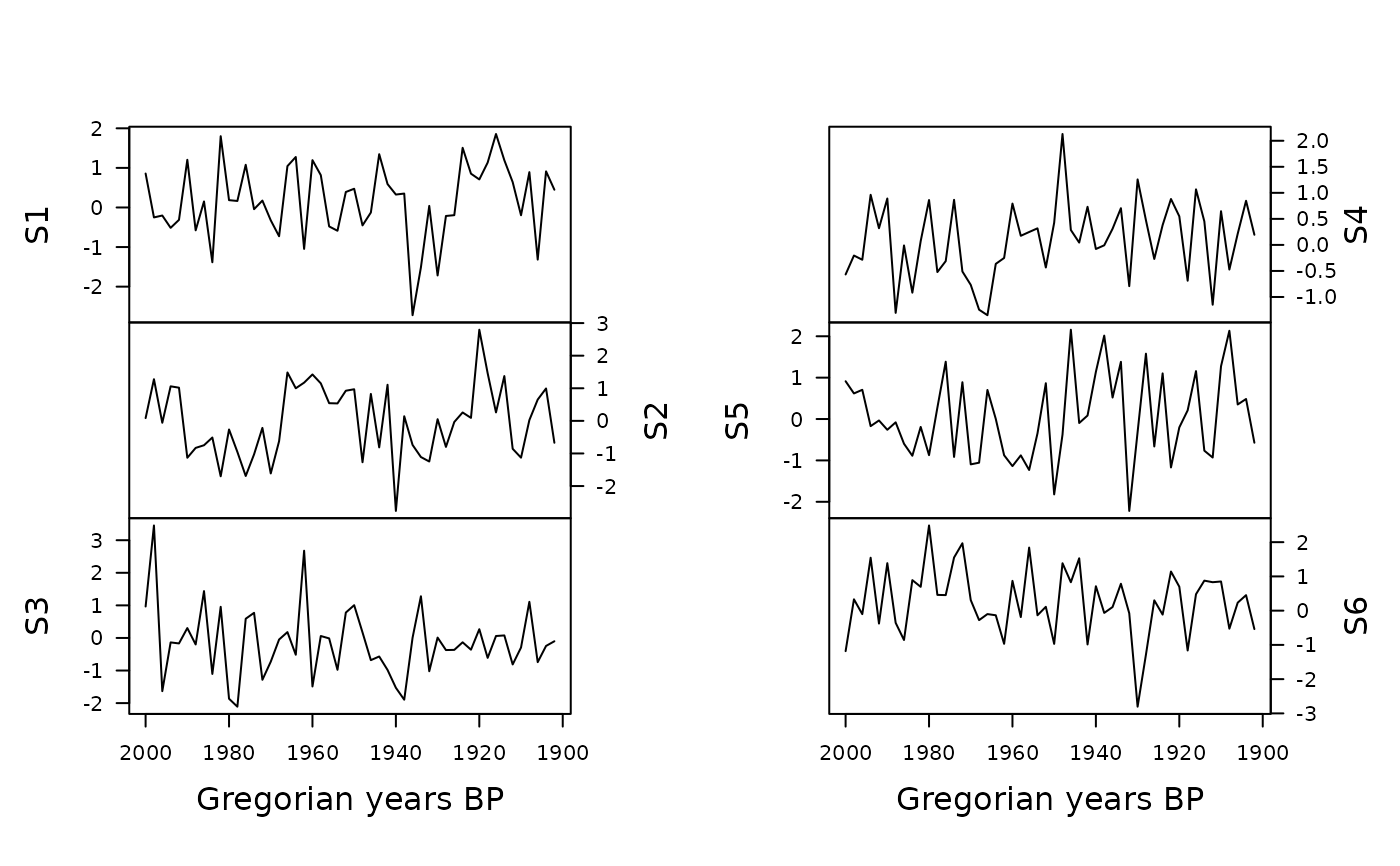
## Multiple
plot(X) # Default calendar
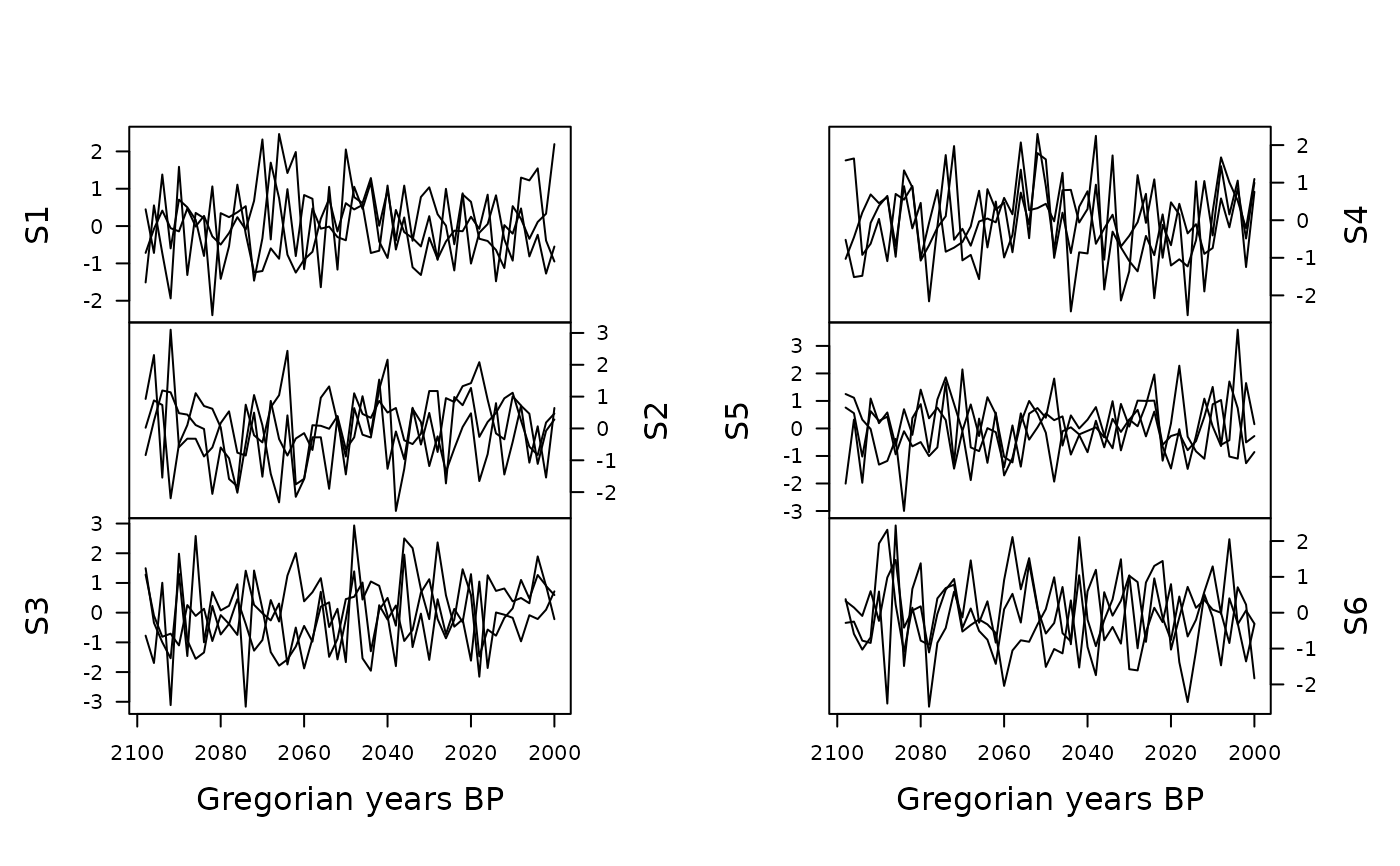
 plot(X, calendar = BP(), flip = TRUE) # BP
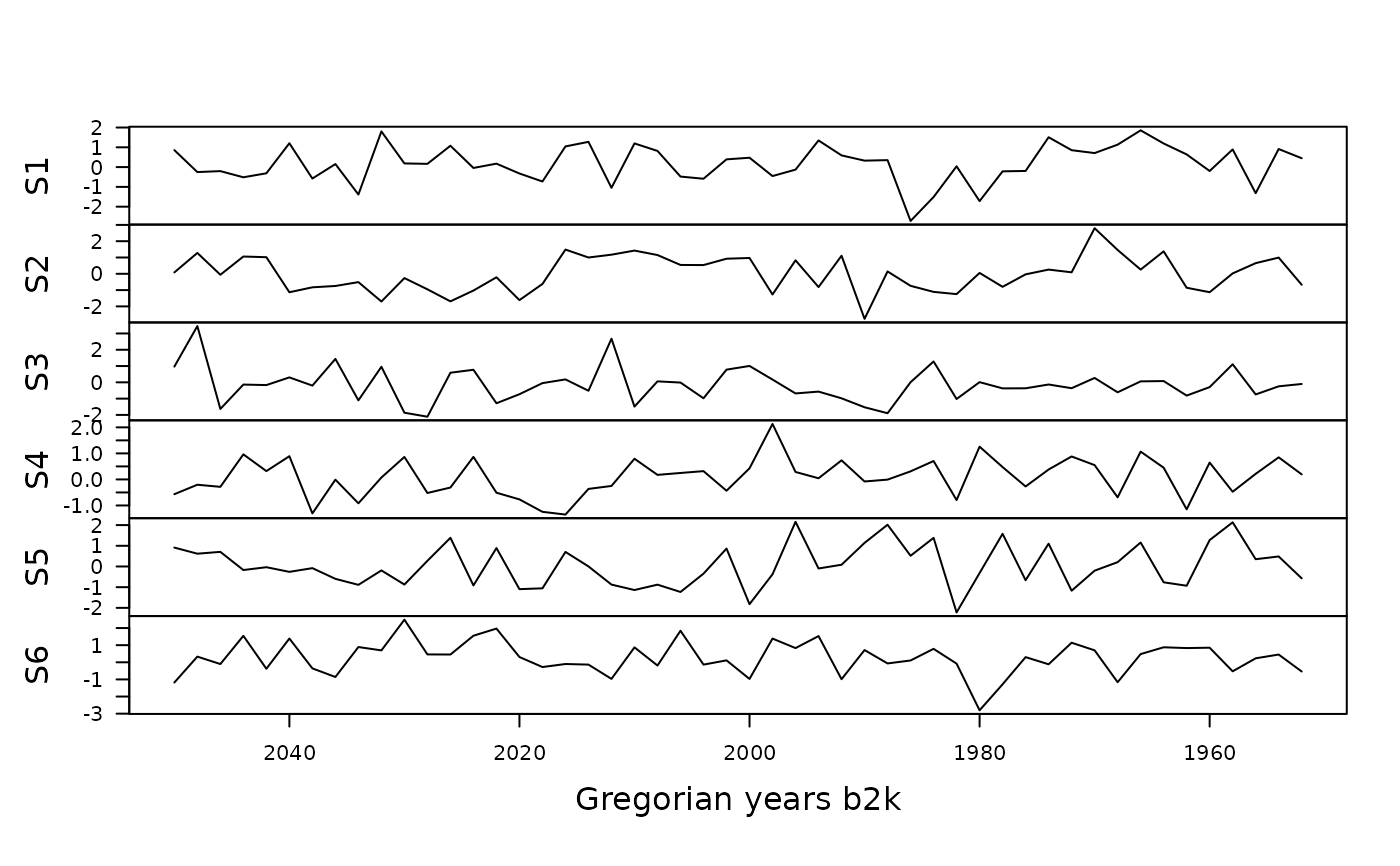
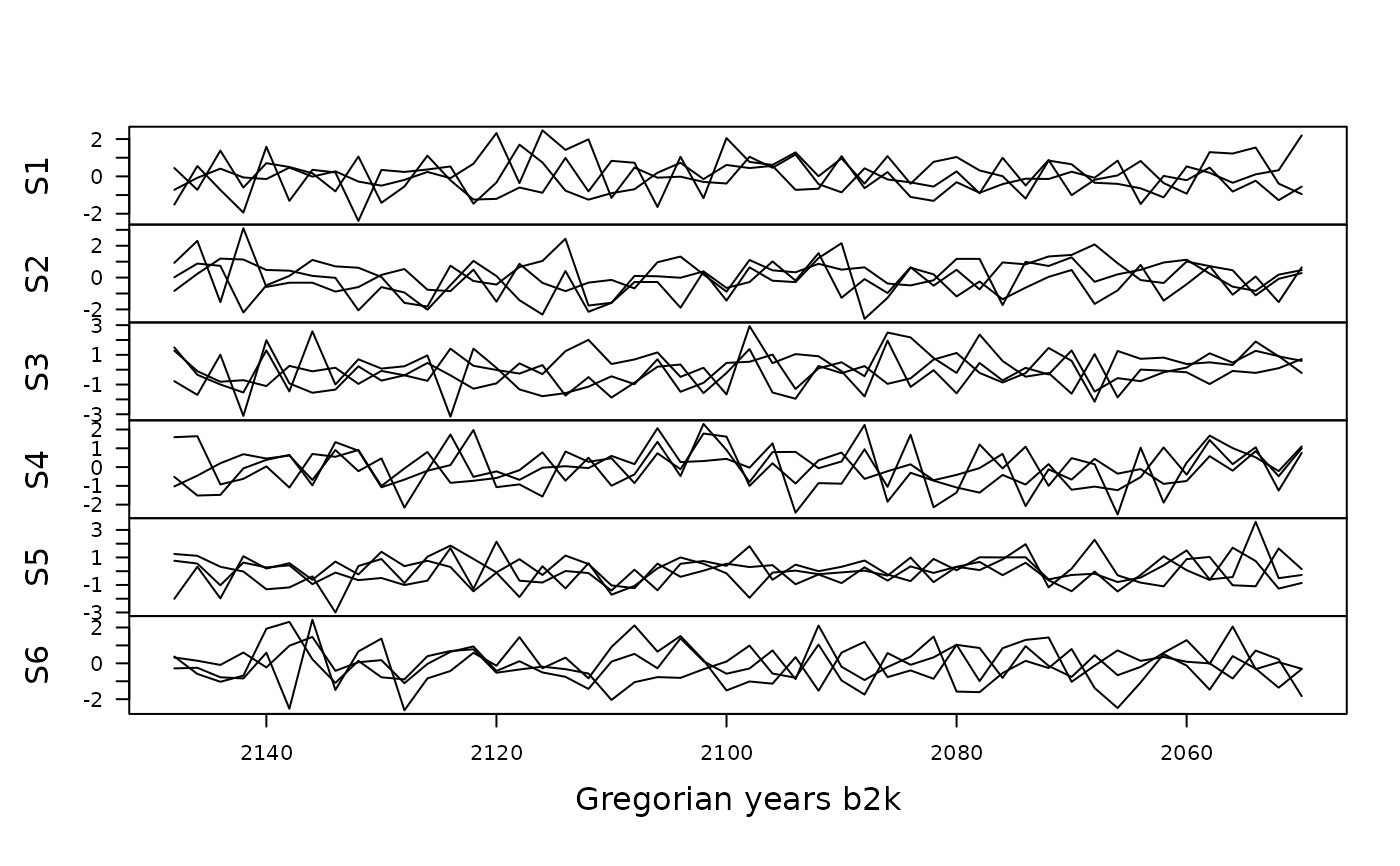
 plot(X, calendar = b2k(), ncol = 1) # b2k
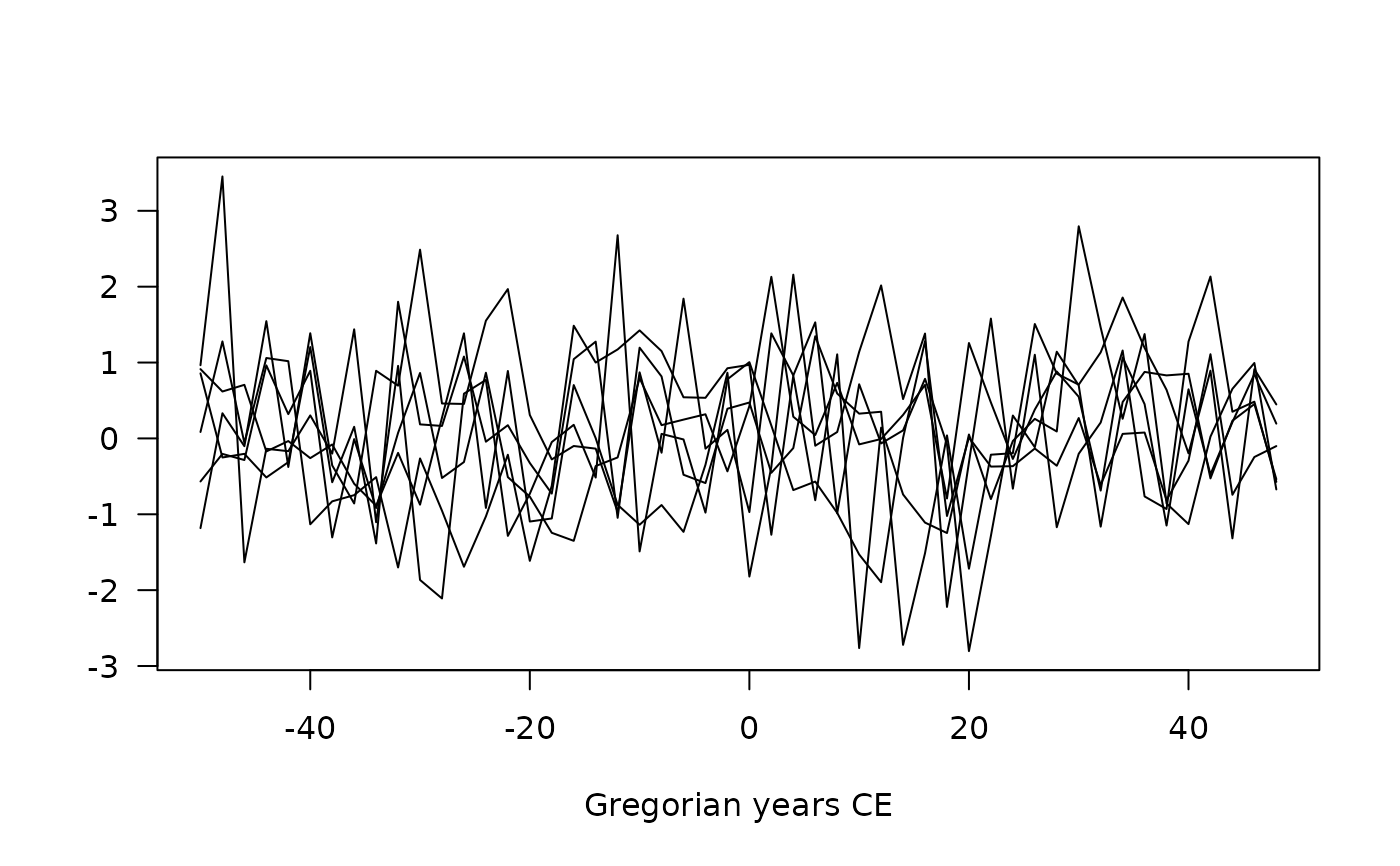
 ## Single
plot(X, facet = "single") # CE
## Single
plot(X, facet = "single") # CE
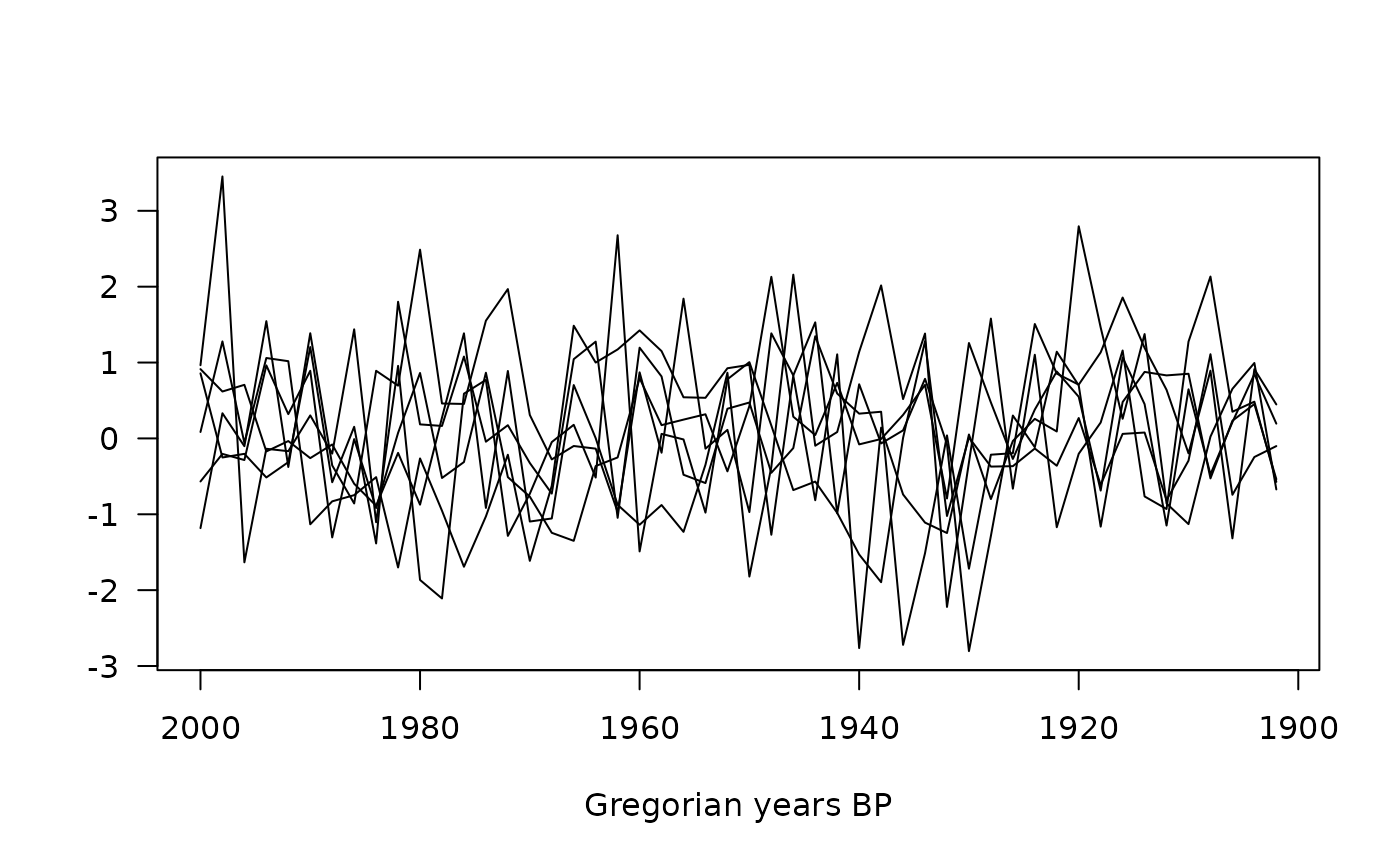
 plot(X, facet = "single", calendar = BP()) # BP
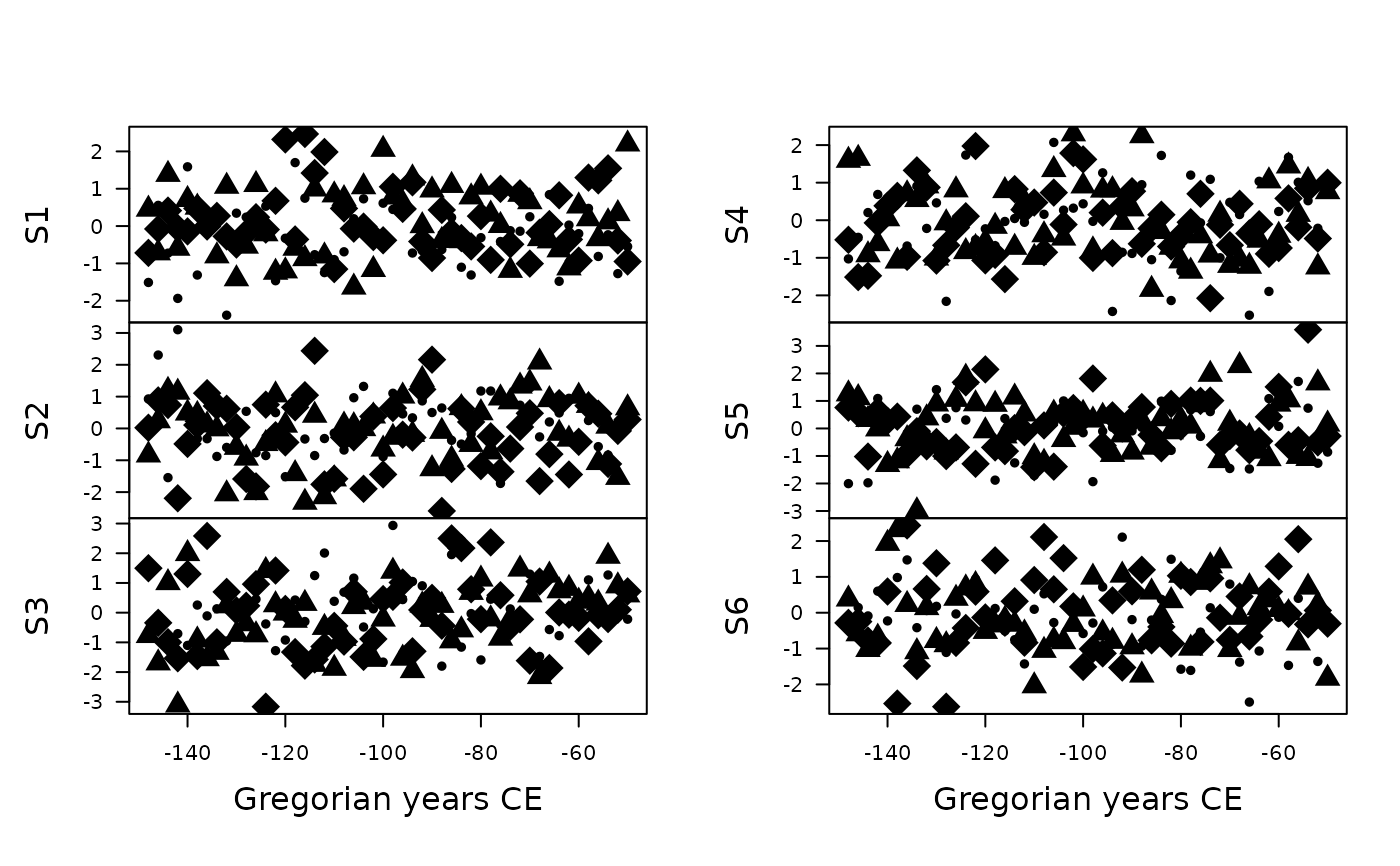
 ## Create 6 x 3 time-series of 50 observations
## Sampled every two years starting from 2000 BP
X <- series(
object = array(rnorm(900), dim = c(50, 6, 3)),
time = seq(2000, by = 2, length.out = 50),
calendar = BP()
)
plot(X, calendar = BP(), flip = TRUE) # BP
## Create 6 x 3 time-series of 50 observations
## Sampled every two years starting from 2000 BP
X <- series(
object = array(rnorm(900), dim = c(50, 6, 3)),
time = seq(2000, by = 2, length.out = 50),
calendar = BP()
)
plot(X, calendar = BP(), flip = TRUE) # BP
 plot(X, calendar = b2k(), ncol = 1) # b2k
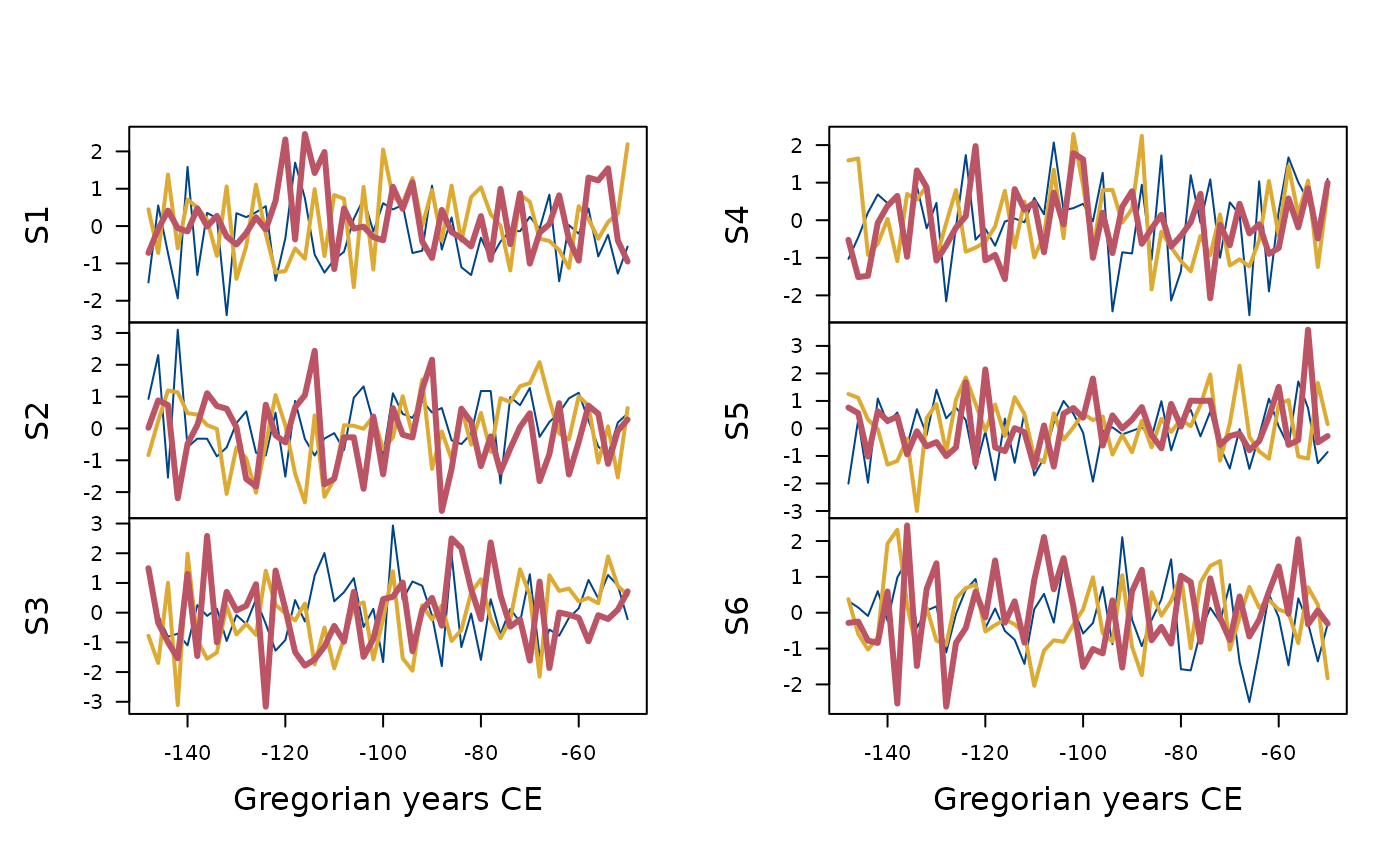
 ## Graphical parameters
plot(X, lwd = c(1, 2, 3), col = c("#004488", "#DDAA33", "#BB5566"))
## Graphical parameters
plot(X, lwd = c(1, 2, 3), col = c("#004488", "#DDAA33", "#BB5566"))
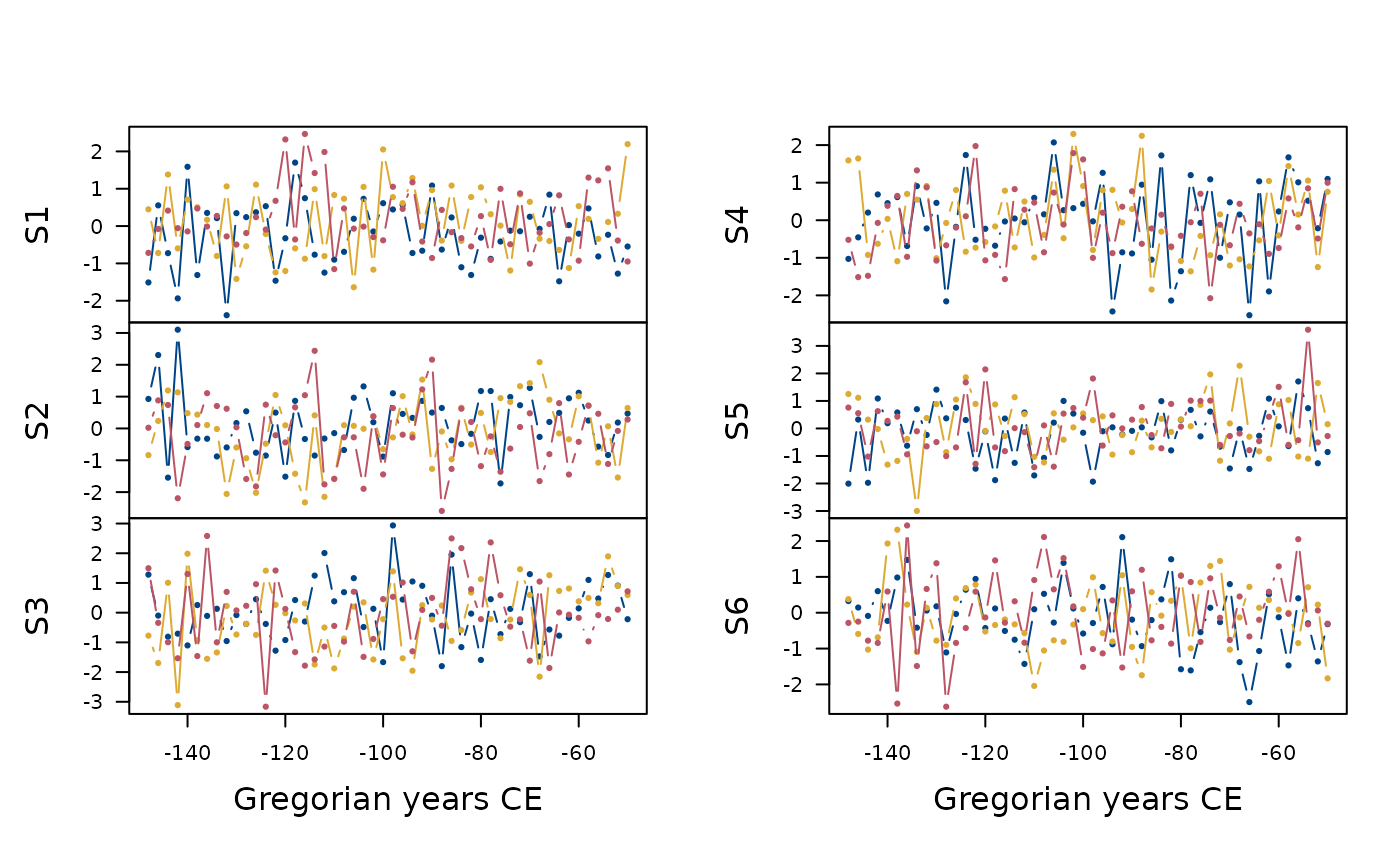
 plot(X, type = "b", pch = 16, col = c("#004488", "#DDAA33", "#BB5566"))
 plot(X, type = "p", pch = c(16, 17, 18), cex = c(1, 2, 3))