Time Series Plotting Functions
Usage
year_axis(
  side,
  at = NULL,
  format = c("a", "ka", "Ma", "Ga"),
  labels = TRUE,
  calendar = get_calendar("current"),
  current_calendar = get_calendar("current"),
  ...
)
Arguments
- side
An
integerspecifying which side of the plot the axis is to be drawn on. The axis is placed as follows: 1=below, 2=left, 3=above and 4=right.- at
A
numericvector giving the points at which tick-marks are to be drawn. IfNULL, tickmark locations are computed.- format
A
characterstring specifying the prefix. It should be one of "a", "ka", "Ma" or "Ga". IfTRUE, a good guess for an appropriate format is made.- labels
A
logicalscalar specifying whether annotations are to be made at the tickmarks, or a vector ofcharacterstrings to be placed at the tickpoints.- calendar
A
TimeScaleobject specifying the target calendar (seecalendar()).- current_calendar
A
TimeScaleobject specifying the calendar used by the last call toplot().- ...
Further parameters to be passed to
graphics::axis(). (e.g. graphical parameters).
Examples
## Create a time-series of 300 observations
## Sampled every two years starting from 2000 BP
X <- series(
object = rnorm(300),
time = seq(2000, by = -2, length.out = 300),
calendar = BP()
)
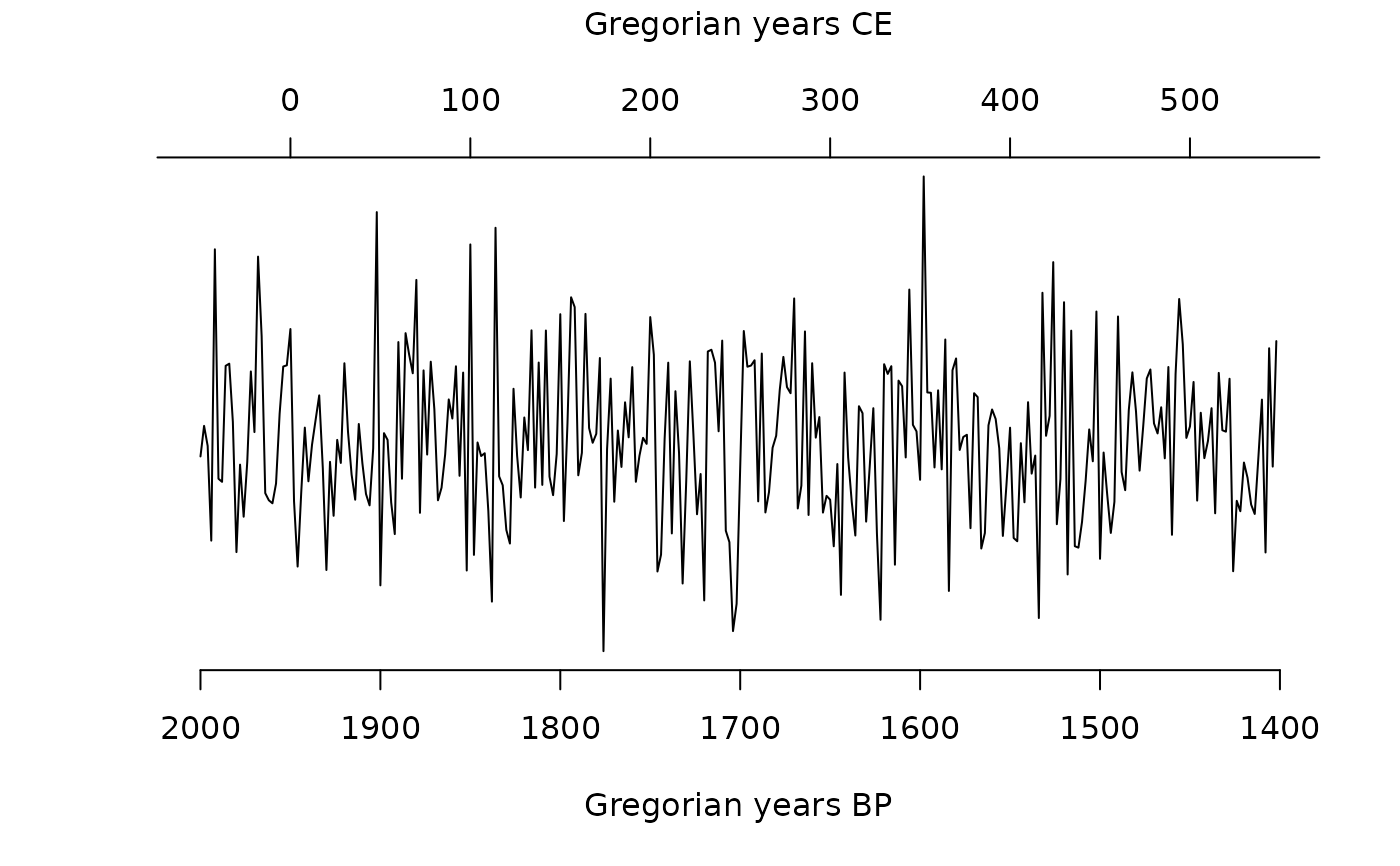
## Axis
plot(X, axes = FALSE, calendar = BP()) # Remove axes
year_axis(side = 1) # Same calendar as last plot
year_axis(side = 3, calendar = CE()) # Specific calendar
mtext(format(CE()), side = 3, line = 3)
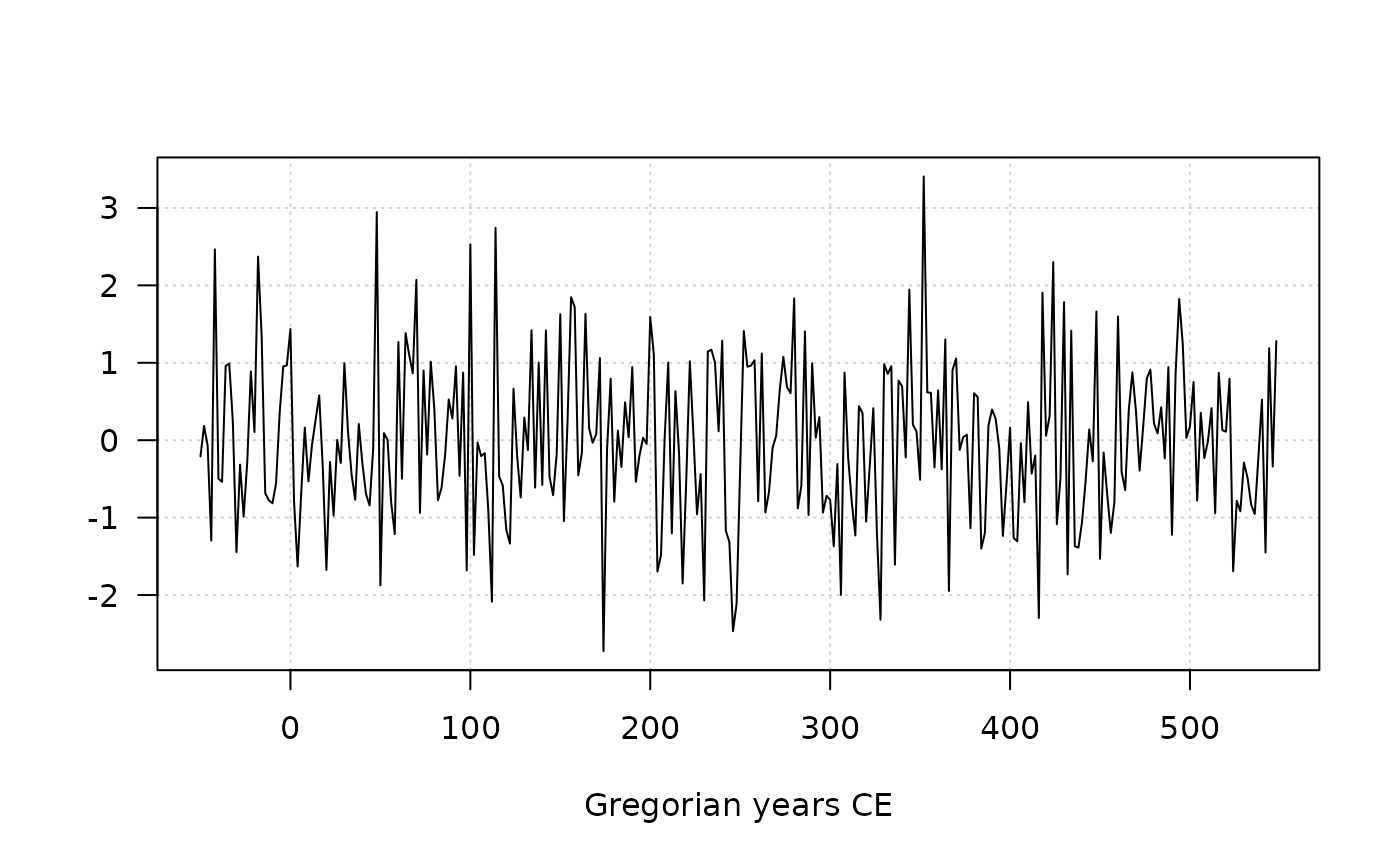
 ## Grid
plot(X, panel.first = graphics::grid())
## Grid
plot(X, panel.first = graphics::grid())