Radial Plot
Usage
radialplot(values, errors, ...)

# S4 method for class 'numeric,numeric'
radialplot(
  values,
  errors,
  log = TRUE,
  centrality = c("weighted.mean", "mean", "median"),
  bar = FALSE,
  grid = TRUE,
  main = NULL,
  sub = NULL,
  ann = graphics::par("ann"),
  ...
)

# S4 method for class 'CalibratedAges,missing'
radialplot(
  values,
  log = TRUE,
  centrality = c("weighted.mean", "mean", "median"),
  bar = FALSE,
  grid = TRUE,
  main = NULL,
  sub = NULL,
  ann = graphics::par("ann"),
  ...
)
Arguments
- values
A
numericvector giving the BP ages or F14C values to be calibrated (conventional ages) or aCalibratedAgesobject.- errors
A
numericvector giving the errors associated to the values to be calibrated.- ...
Further graphical parameters to be passed to
graphics::points().- log
A
logicalscalar: should the z-axis be displayed in logarithmic scale?- centrality
A
characterstring specifying a measure of centrality, used for centering the plot. It must be one of "weighted.mean" (the default), "mean" or "median". Any unambiguous substring can be given.- bar
A
logicalscalar: should a bar showing the 2-sigma range around the central value be displayed?- grid
A
logicalscalar: should a grid (originating at \([0,0]\) and stretching to the z-scale) be displayed?- main
A
characterstring giving a main title for the plot.- sub
A
characterstring giving a subtitle for the plot.- ann
A
logicalscalar: should the default annotation (title and x and y labels) appear on the plot?
References
Galbraith, Rex F. (1988). Graphical Display of Estimates Having Differing Standard Errors. Technometrics, 30(3): 271-281. doi:10.1080/00401706.1988.10488400 .
Galbraith, Rex F. (1990). The Radial Plot: Graphical Assessment of Spread in Ages. International Journal of Radiation Applications and Instrumentation. Part D. Nuclear Tracks and Radiation Measurements, 17(3): 207-214. doi:10.1016/1359-0189(90)90036-W .
Galbraith, Rex F. (1994). Some Applications of Radial Plots. Journal of the American Statistical Association, 89(428): 1232-1242. doi:10.1080/01621459.1994.10476864 .
See also
Other statistics:
interval_credible,
interval_hdr,
mean(),
median(),
quantile()
Examples
## Data from Bosch et al. 2015
data("ksarakil")
## Radialplot
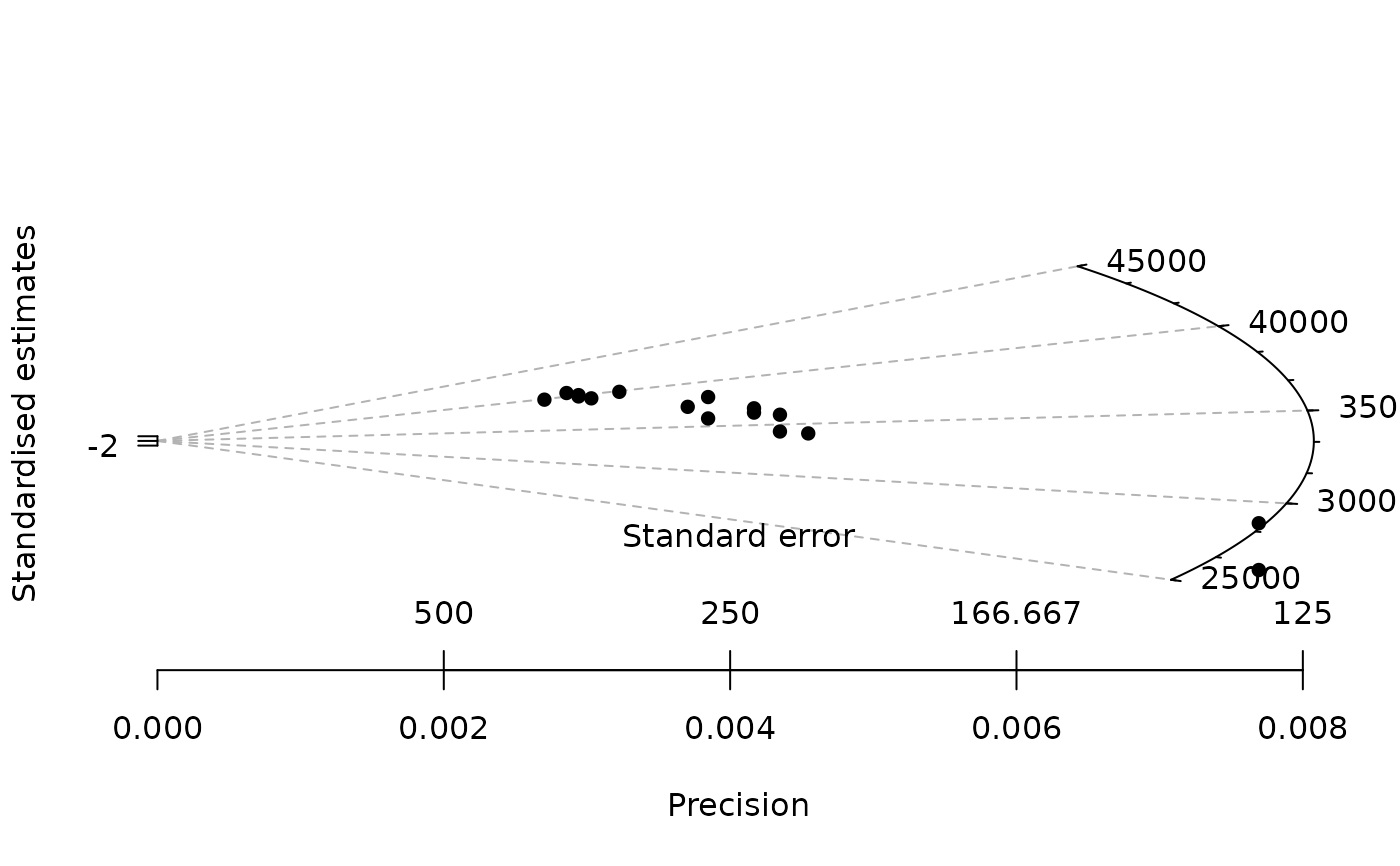
radialplot(ksarakil$date, ksarakil$error, pch = 16)
 ## Linear z-scale
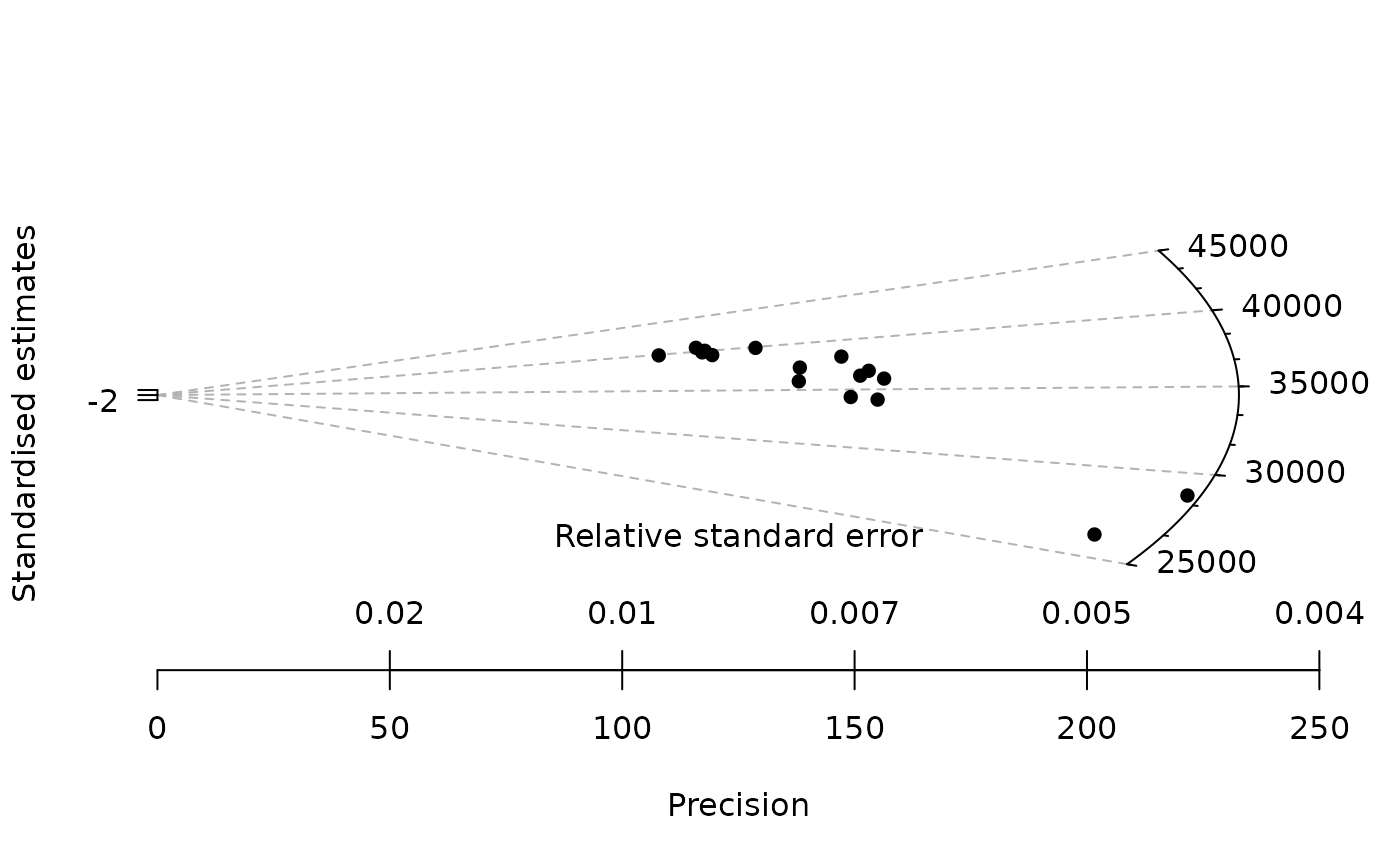
radialplot(ksarakil$date, ksarakil$error, log = FALSE, pch = 16)
## Linear z-scale
radialplot(ksarakil$date, ksarakil$error, log = FALSE, pch = 16)