Plots column/variable principal coordinates.
Usage
viz_variables(x, ...)

viz_columns(x, ...)

# S4 method for class 'MultivariateAnalysis'
viz_columns(
  x,
  ...,
  axes = c(1, 2),
  active = TRUE,
  sup = TRUE,
  labels = FALSE,
  extra_quali = NULL,
  extra_quanti = NULL,
  color = NULL,
  fill = FALSE,
  symbol = FALSE,
  size = c(1, 6),
  xlim = NULL,
  ylim = NULL,
  main = NULL,
  sub = NULL,
  panel.first = NULL,
  panel.last = NULL,
  legend = list(x = "topleft")
)

# S4 method for class 'MultivariateBootstrap'
viz_columns(
  x,
  ...,
  axes = c(1, 2),
  color = FALSE,
  fill = FALSE,
  symbol = FALSE,
  legend = NULL
)

# S4 method for class 'PCA'
viz_variables(
  x,
  ...,
  axes = c(1, 2),
  active = TRUE,
  sup = TRUE,
  labels = list(filter = "contribution", n = 10),
  extra_quali = NULL,
  extra_quanti = NULL,
  color = NULL,
  symbol = NULL,
  size = 1,
  xlim = NULL,
  ylim = NULL,
  main = NULL,
  sub = NULL,
  panel.first = NULL,
  panel.last = NULL,
  legend = list(x = "topleft")
)

# S4 method for class 'CA'
viz_variables(
  x,
  ...,
  axes = c(1, 2),
  active = TRUE,
  sup = TRUE,
  labels = FALSE,
  extra_quali = NULL,
  extra_quanti = NULL,
  color = NULL,
  fill = FALSE,
  symbol = FALSE,
  size = c(1, 6),
  xlim = NULL,
  ylim = NULL,
  main = NULL,
  sub = NULL,
  panel.first = NULL,
  panel.last = NULL,
  legend = list(x = "topleft")
)

# S4 method for class 'BootstrapPCA'
viz_variables(
  x,
  ...,
  axes = c(1, 2),
  color = FALSE,
  fill = FALSE,
  symbol = FALSE,
  legend = NULL
)
Arguments
- x
- ...
Further graphical parameters.
- axes
A length-two
numericvector giving the dimensions to be plotted.- active
A
logicalscalar: should the active observations be plotted?- sup
A
logicalscalar: should the supplementary observations be plotted?- labels
A
logicalscalar: should labels be drawn? Labeling a large number of points can be computationally expensive and make the graph difficult to read. A selection of points to label can be provided using alistof two named elements,filter(a string specifying how to filter the labels to be drawn) andn(an integer specifying the number of labels to be drawn). See examples below.- extra_quali
An optional vector of qualitative data for aesthetics mapping.
- extra_quanti
An optional vector of quantitative data for aesthetics mapping. If a single
characterstring is passed, it must be one of "observation", "mass", "sum", "contribution" or "cos2" (seeaugment()).- color
The colors for lines and points (will be mapped to
extra_quantiorextra_quali; if both are set, the latter has priority). Ignored if set toFALSE. IfNULL, the default color scheme will be used.- fill
The background colors for points (will be mapped to
extra_quantiorextra_quali; if both are set, the latter has priority). Ignored if set toFALSE.- symbol
A vector of plotting characters or symbols (will be mapped to
extra_quali). This can either be a single character or an integer code for one of a set of graphics symbols. Ifsymbolis a named a named vector, then the symbols will be associated with their name withinextra_quali. Ignored if set toFALSE.- size
A length-two
numericvector giving range of possible sizes (greater than 0; will be mapped toextra_quanti). Ignored if set toFALSE.- xlim
A length-two
numericvector giving the x limits of the plot. The default value,NULL, indicates that the range of the finite values to be plotted should be used.- ylim
A length-two
numericvector giving the y limits of the plot. The default value,NULL, indicates that the range of the finite values to be plotted should be used.- main
A
characterstring giving a main title for the plot.- sub
A
characterstring giving a subtitle for the plot.- panel.first
An
expressionto be evaluated after the plot axes are set up but before any plotting takes place. This can be useful for drawing background grids.- panel.last
An
expressionto be evaluated after plotting has taken place but before the axes, title and box are added.- legend
A
listof additional arguments to be passed tographics::legend(); names of the list are used as argument names. IfNULL, no legend is displayed.
Value
viz_*() is called for its side-effects: it results in a graphic
being displayed. Invisibly returns x.
See also
Other plot methods:
biplot(),
plot(),
screeplot(),
viz_contributions(),
viz_individuals()
Examples
## Load data
data("iris")
## Compute principal components analysis
X <- pca(iris, scale = TRUE, sup_quali = "Species")
## Plot individuals
viz_individuals(X, panel.last = graphics::grid())
 ## Labels of the 10 individuals with highest cos2
viz_individuals(X, labels = list(filter = "cos2", n = 10))
## Labels of the 10 individuals with highest cos2
viz_individuals(X, labels = list(filter = "cos2", n = 10))
 ## Plot variables
viz_variables(X, panel.last = graphics::grid())
## Plot variables
viz_variables(X, panel.last = graphics::grid())
 ## Graphical parameters
## Continuous values
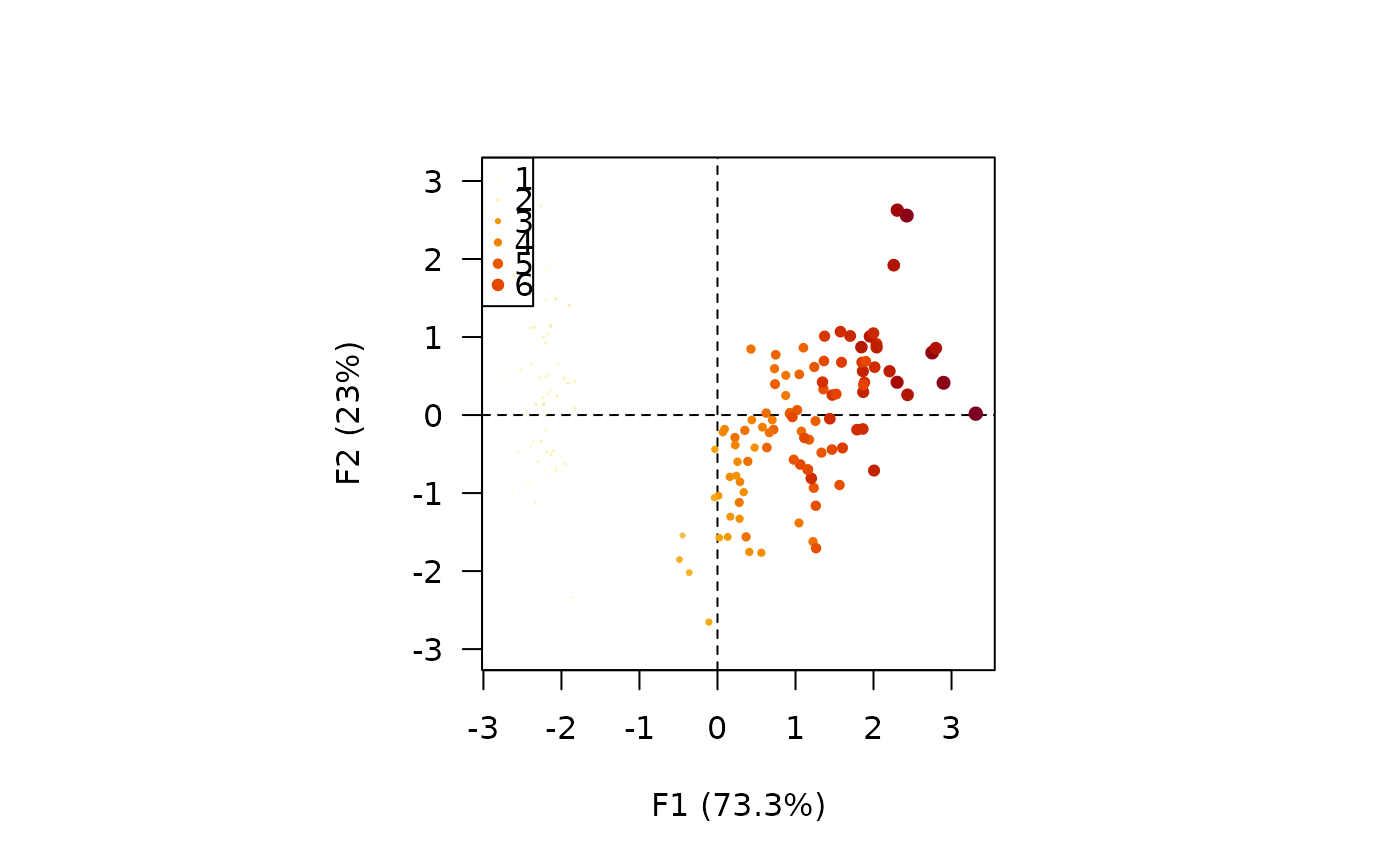
viz_individuals(X, extra_quanti = iris$Petal.Length, symbol = 16, size = c(1, 2))
## Graphical parameters
## Continuous values
viz_individuals(X, extra_quanti = iris$Petal.Length, symbol = 16, size = c(1, 2))
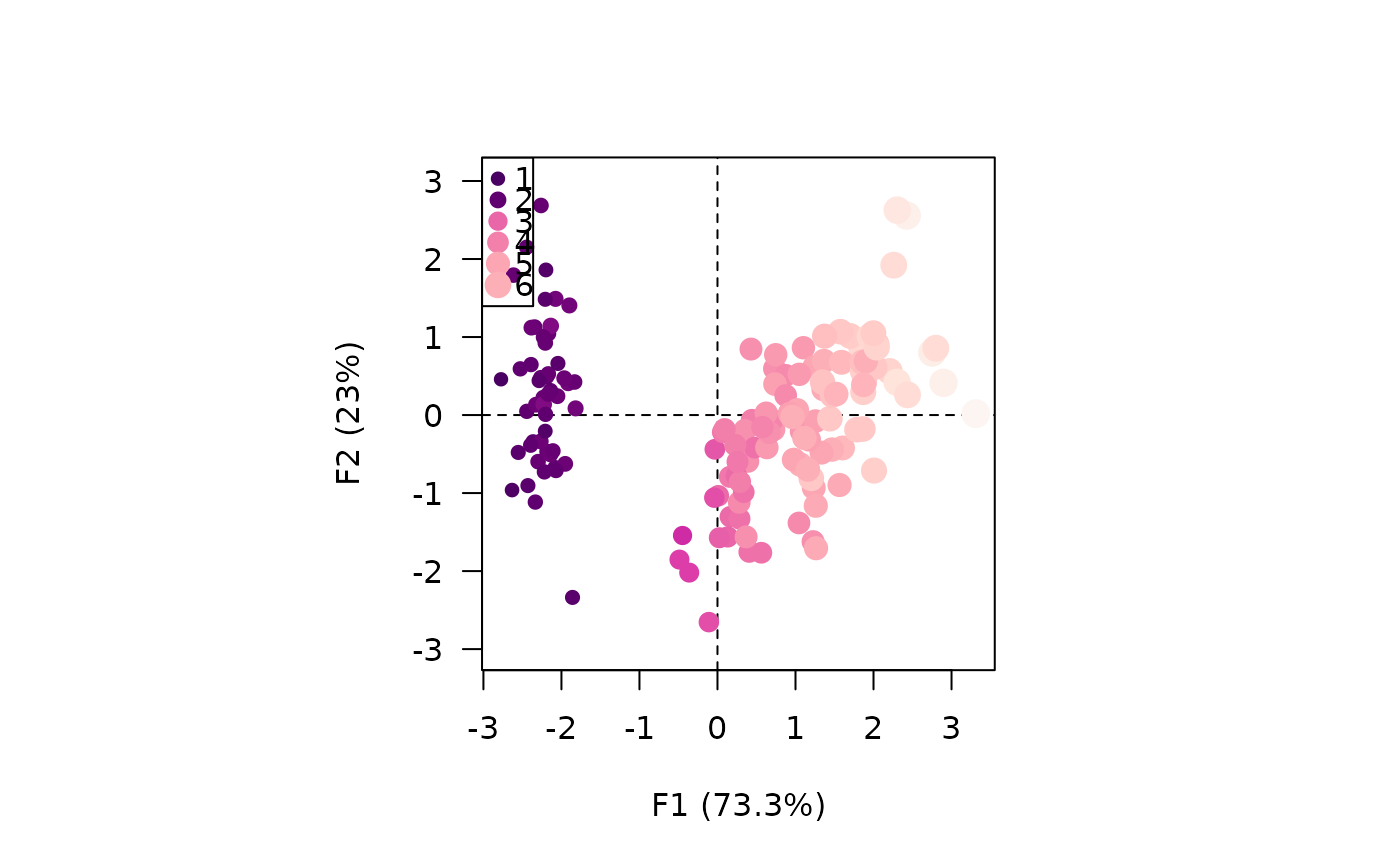
 viz_individuals(X, extra_quanti = iris$Petal.Length, symbol = 16, size = c(1, 2),
color = grDevices::hcl.colors(12, "RdPu"))
viz_individuals(X, extra_quanti = iris$Petal.Length, symbol = 16, size = c(1, 2),
color = grDevices::hcl.colors(12, "RdPu"))
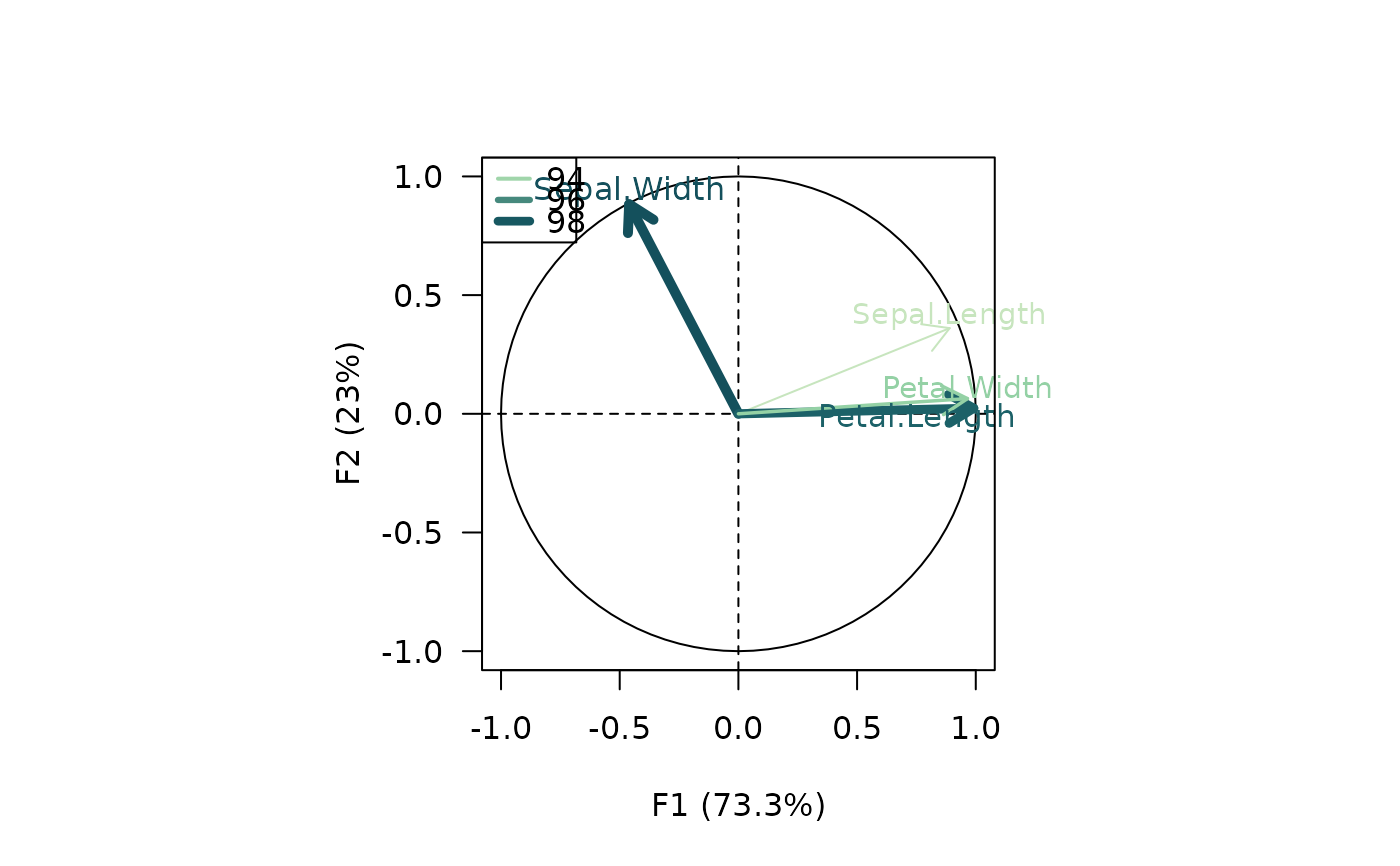
 viz_variables(X, extra_quanti = "contribution",
color = grDevices::hcl.colors(12, "BluGrn", rev = TRUE),
size = c(0, 1))
viz_variables(X, extra_quanti = "contribution",
color = grDevices::hcl.colors(12, "BluGrn", rev = TRUE),
size = c(0, 1))
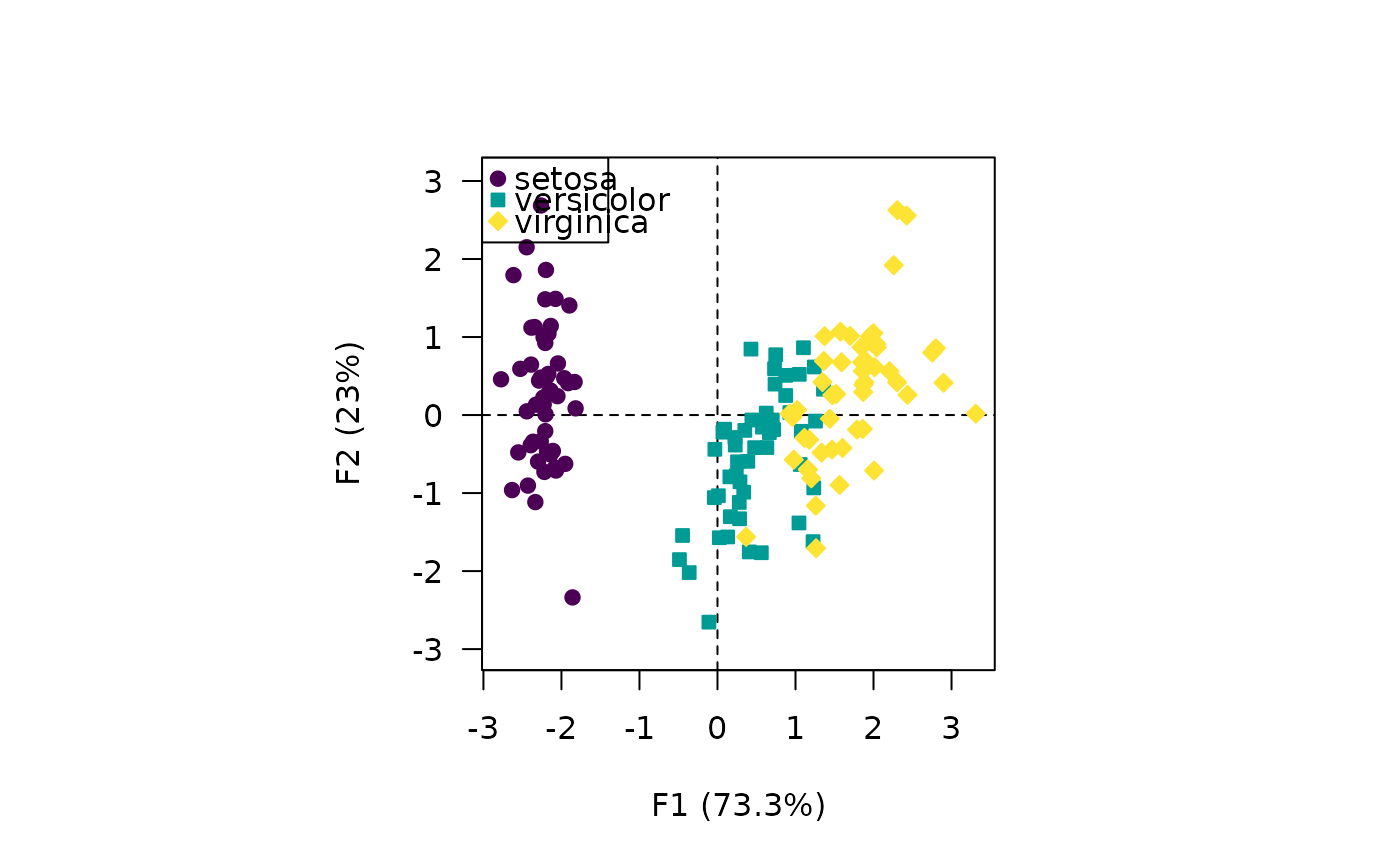
 ## Discrete values
viz_individuals(X, extra_quali = iris$Species, symbol = 21:23)
## Discrete values
viz_individuals(X, extra_quali = iris$Species, symbol = 21:23)
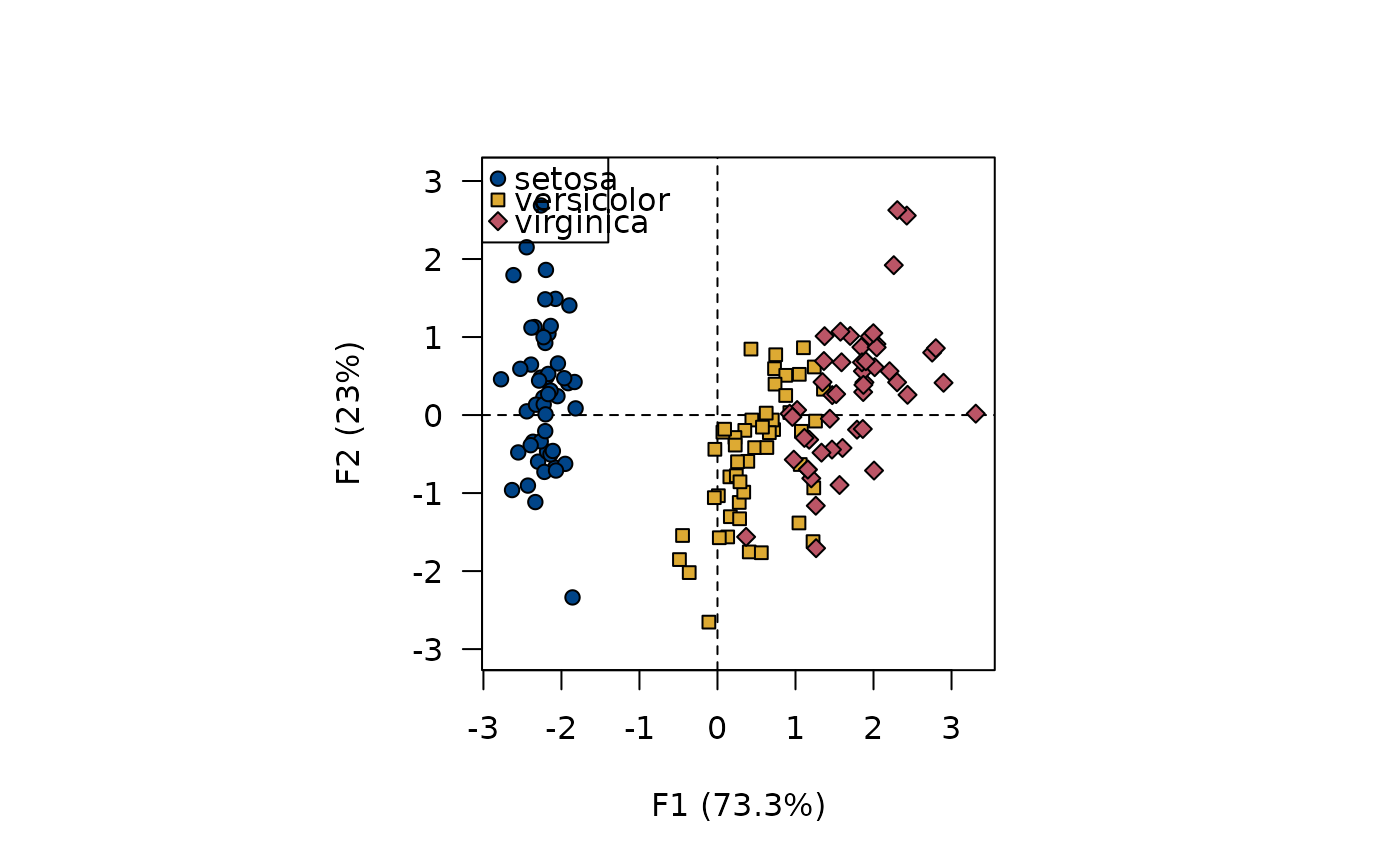
 viz_individuals(X, extra_quali = iris$Species, symbol = 21:23,
fill = c("#004488", "#DDAA33", "#BB5566"),
color = "black")
#> Warning: Only 1 color was specified (3 are required).
viz_individuals(X, extra_quali = iris$Species, symbol = 21:23,
fill = c("#004488", "#DDAA33", "#BB5566"),
color = "black")
#> Warning: Only 1 color was specified (3 are required).
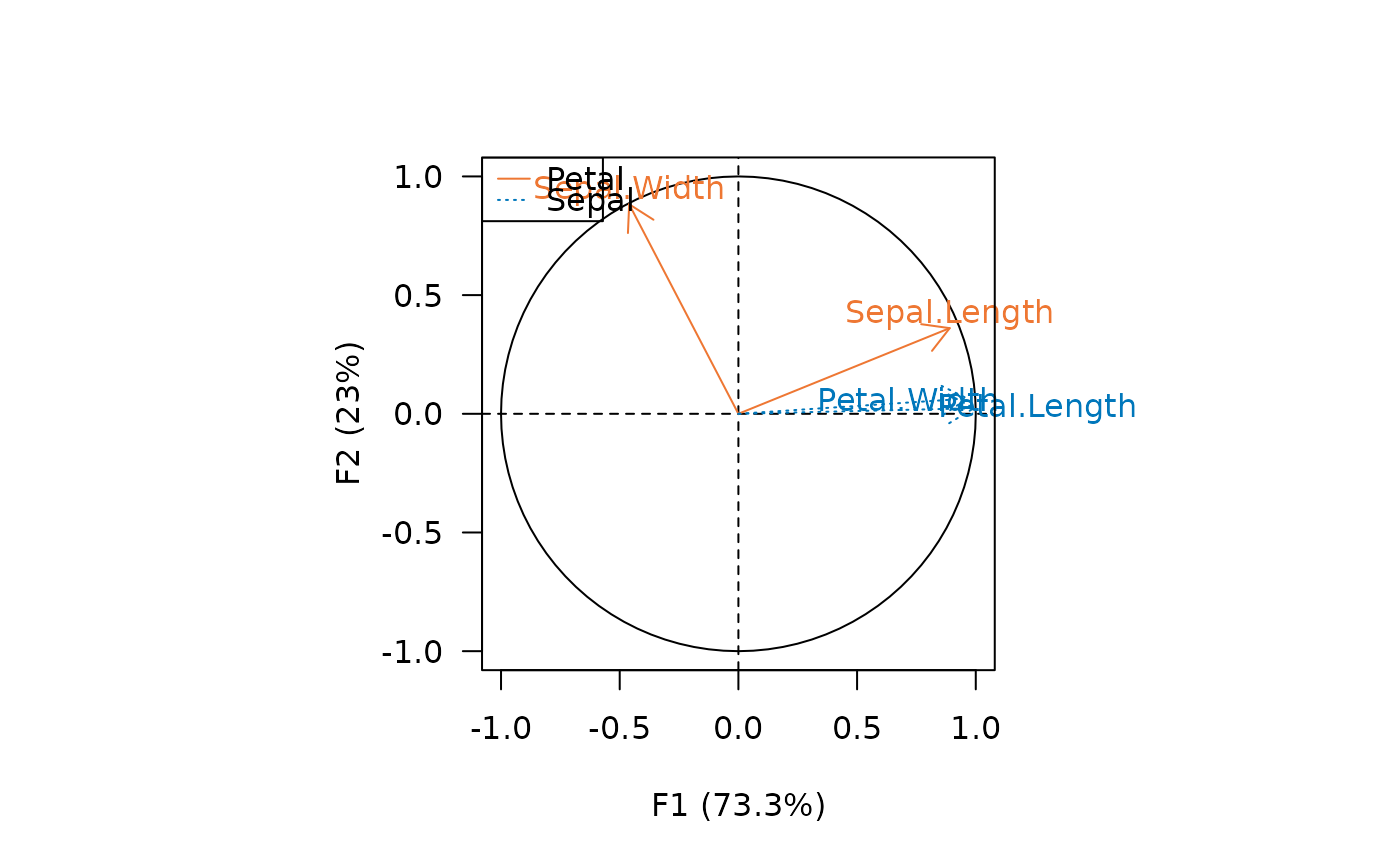
 viz_variables(X, extra_quali = c("Petal", "Petal", "Sepal", "Sepal"),
color = c("#EE7733", "#0077BB"),
symbol = c(1, 3))
viz_variables(X, extra_quali = c("Petal", "Petal", "Sepal", "Sepal"),
color = c("#EE7733", "#0077BB"),
symbol = c(1, 3))