Fabio Crameri's Sequential Color Schemes for ggplot2 and ggraph
Source:R/scale_colour_crameri.R
scale_crameri_sequential.RdProvides sequential color scales from Fabio Crameri's Scientific colour.
Source
Crameri, F. (2021). Scientific colour maps. Zenodo, v7.0. doi:10.5281/zenodo.4491293
Arguments
- ...
Arguments passed to
ggplot2::continuous_scale().- reverse
A
logicalscalar. Should the resulting vector of colors be reversed?- range
A length-two
numericvector specifying the fraction of the scheme's color domain to keep.- aesthetics
A
characterstring or vector of character strings listing the name(s) of the aesthetic(s) that this scale works with.- discrete
A
logicalscalar: should the color scheme be used as a discrete scale?
Value
A continuous scale.
Details
Available schemes:
batlowbatlowWbatlowKdevonlajollabamakodavosbilbaonuukoslograyChawaiilapaztokyobudaactonturkuimola
Interpolation
If more colors than defined are needed from a given scheme, the color coordinates are linearly interpolated to provide a continuous version of the scheme.
Note that the default color for NA can be overridden by passing
a value to ggplot2::continuous_scale().
References
Crameri, F. (2018). Geodynamic diagnostics, scientific visualisation and StagLab 3.0. Geosci. Model Dev., 11, 2541-2562. doi:10.5194/gmd-11-2541-2018
Crameri, F., Shephard, G. E. & Heron, P. J. (2020). The misuse of colour in science communication. Nature Communications, 11, 5444. doi:10.1038/s41467-020-19160-7
See also
Other color-blind safe color schemes:
scale_crameri_cyclic,
scale_crameri_diverging,
scale_crameri_mutlisequential,
scale_okabeito_discrete,
scale_tol_discrete,
scale_tol_diverging,
scale_tol_sequential
Examples
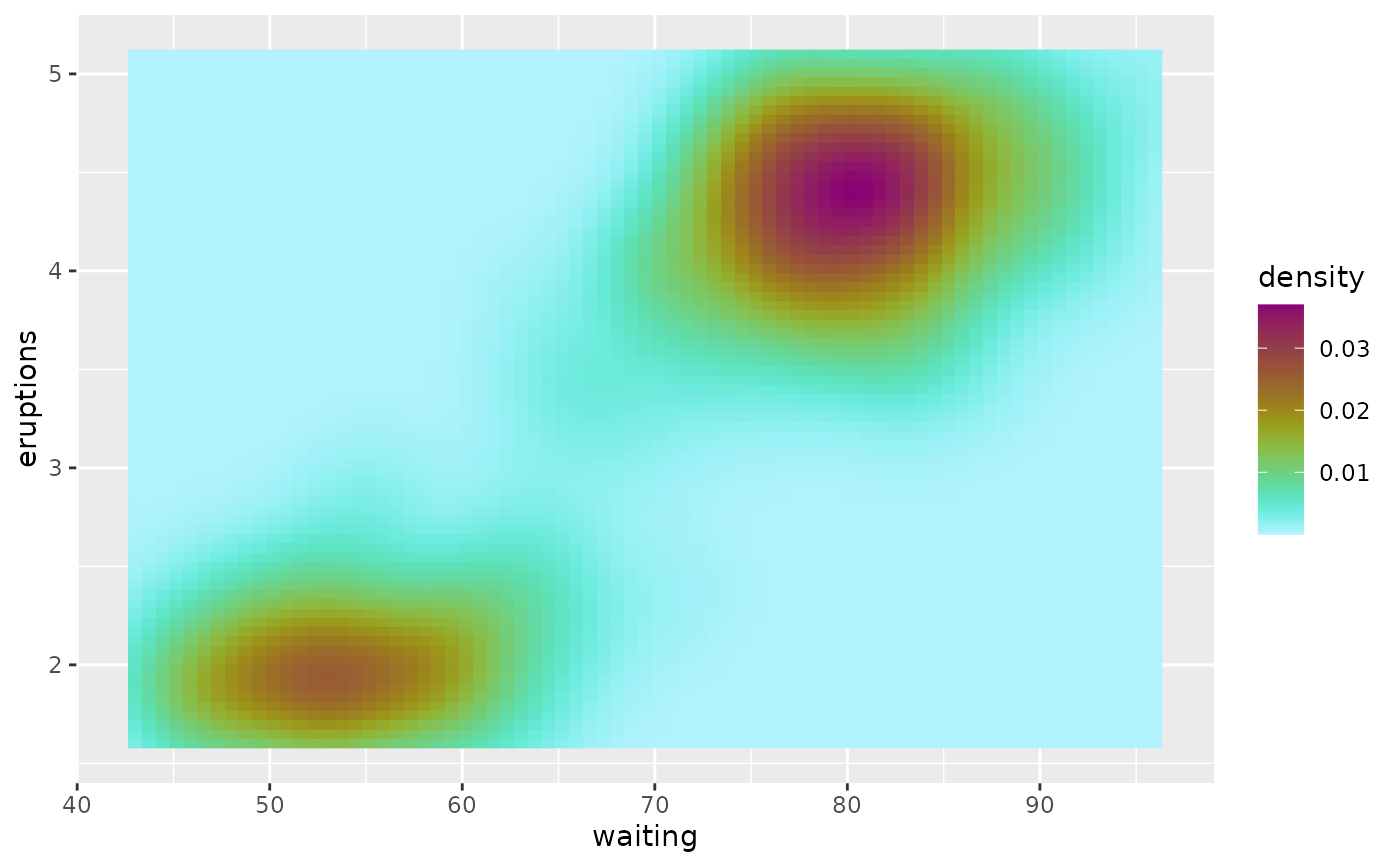
data(faithfuld, package = "ggplot2")
ggplot2::ggplot(faithfuld, ggplot2::aes(waiting, eruptions, fill = density)) +
ggplot2::geom_raster() +
scale_fill_batlow()
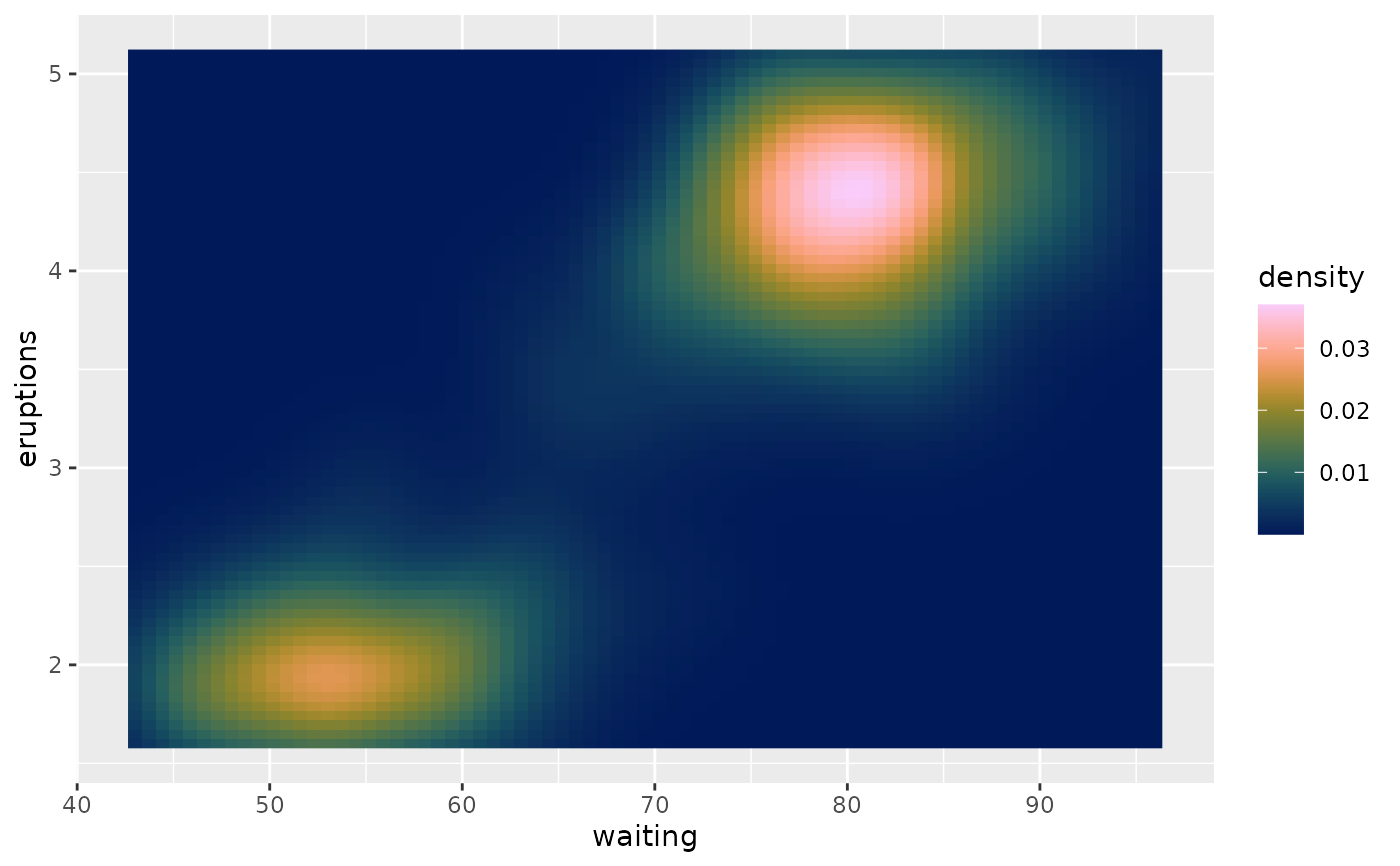 ggplot2::ggplot(faithfuld, ggplot2::aes(waiting, eruptions, fill = density)) +
ggplot2::geom_raster() +
scale_fill_bamako()
ggplot2::ggplot(faithfuld, ggplot2::aes(waiting, eruptions, fill = density)) +
ggplot2::geom_raster() +
scale_fill_bamako()
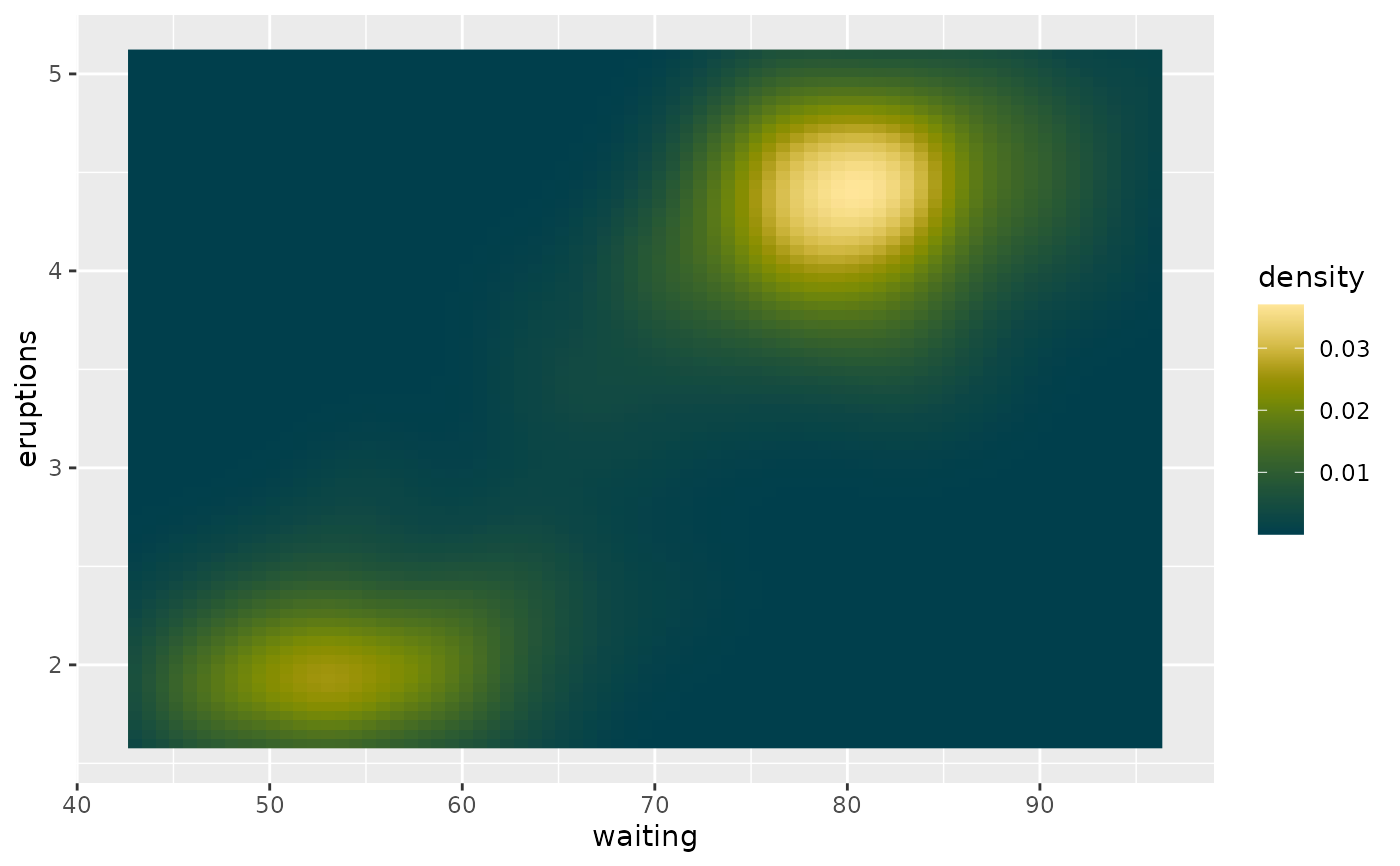 ggplot2::ggplot(faithfuld, ggplot2::aes(waiting, eruptions, fill = density)) +
ggplot2::geom_raster() +
scale_fill_hawaii(reverse = TRUE)
ggplot2::ggplot(faithfuld, ggplot2::aes(waiting, eruptions, fill = density)) +
ggplot2::geom_raster() +
scale_fill_hawaii(reverse = TRUE)