Introduction
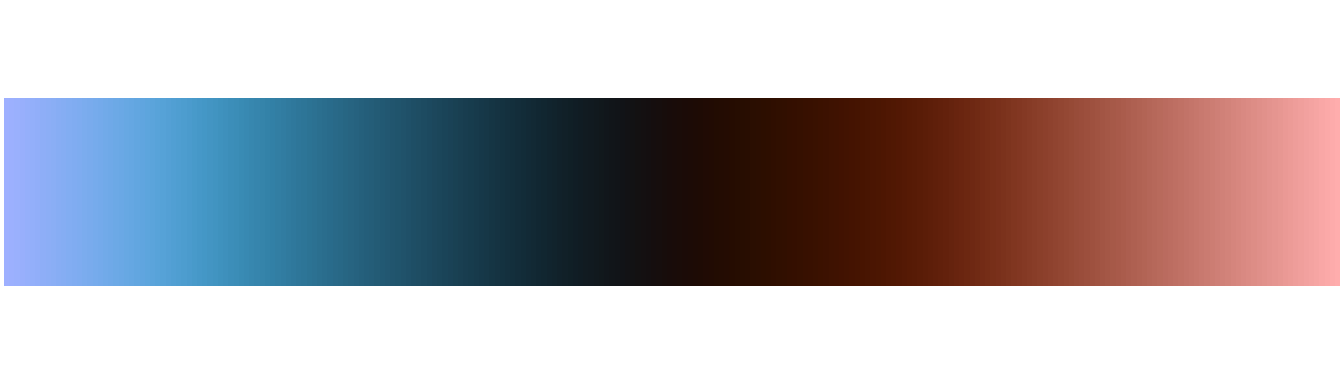
Crameri (2018) offers carefully chosen schemes, ready for mapping data, with colors that are:
- Perceptually uniform,
- Perceptually ordered,
- Color vision deficiency friendly,
- Readable as black and white print,
- Citable & reproducible.
All the scales presented in Crameri (2023) are implemented here, for use with base R graphics, ggplot2 and ggraph.


References
Crameri, F. 2018. “Geodynamic Diagnostics, Scientific Visualisation and StagLab 3.0.” Geoscientific Model Development 11 (6): 2541-2562. DOI: 10.5194/gmd-11-2541-2018.
Crameri, F. 2023. Scientific Colour Maps (version 8.0.1). Zenodo. DOI: 10.5281/zenodo.1243862.