Provides qualitative, diverging and sequential color schemes.
Usage
colour(
  palette,
  reverse = FALSE,
  names = FALSE,
  lang = "en",
  force = FALSE,
  ...
)

color(palette, reverse = FALSE, names = FALSE, lang = "en", force = FALSE, ...)
Arguments
- palette
A
characterstring giving the name of the scheme to be used (seeinfo()).- reverse
A
logicalscalar: should the resulting vector of colors should be reversed?- names
A
logicalscalar: should the names of the colors should be kept in the resulting vector?- lang
A
characterstring specifying the language for the color names. It must be one of "en" (English, the default) or "fr" (French).- force
A
logicalscalar. IfTRUE, forces the color scheme to be interpolated. It should not be used routinely with qualitative color schemes, as they are designed to be used as is to remain color-blind safe.- ...
Further arguments passed to colorRampPalette.
Value
A function function with the following attributes, that when called
with a single argument (an integer specifying the number of colors)
returns a (named) vector of colors.
- palette
A
characterstring giving the name of the color scheme.- type
A
characterstring giving the corresponding data type. One of "qualitative", "diverging" or "sequential".- interpolate
A
logicalscalar: can the color palette be interpolated?- missing
A
characterstring giving the the hexadecimal representation of the color that should be used forNAvalues.- max
An
integergiving the maximum number of color values. Only relevant for non-interpolated color schemes.
For color schemes that can be interpolated (diverging and sequential data),
the color range can be limited with an additional argument. range allows
to remove a fraction of the color domain (before being interpolated; see
examples).
References
Crameri, F. (2018). Geodynamic diagnostics, scientific visualisation and StagLab 3.0. Geosci. Model Dev., 11, 2541-2562. doi:10.5194/gmd-11-2541-2018
Crameri, F., Shephard, G. E. & Heron, P. J. (2020). The misuse of colour in science communication. Nature Communications, 11, 5444. doi:10.1038/s41467-020-19160-7
Jones, A., Montanarella, L. & Jones, R. (Ed.) (2005). Soil atlas of Europe. Luxembourg: European Commission, Office for Official Publications of the European Communities. 128 pp. ISBN: 92-894-8120-X.
Okabe, M. & Ito, K. (2008). Color Universal Design (CUD): How to Make Figures and Presentations That Are Friendly to Colorblind People. URL: https://jfly.uni-koeln.de/color/.
Tol, P. (2021). Colour Schemes. SRON. Technical Note No. SRON/EPS/TN/09-002, issue 3.2. URL: https://sronpersonalpages.nl/~pault/data/colourschemes.pdf
See also
Other color schemes:
info()
Examples
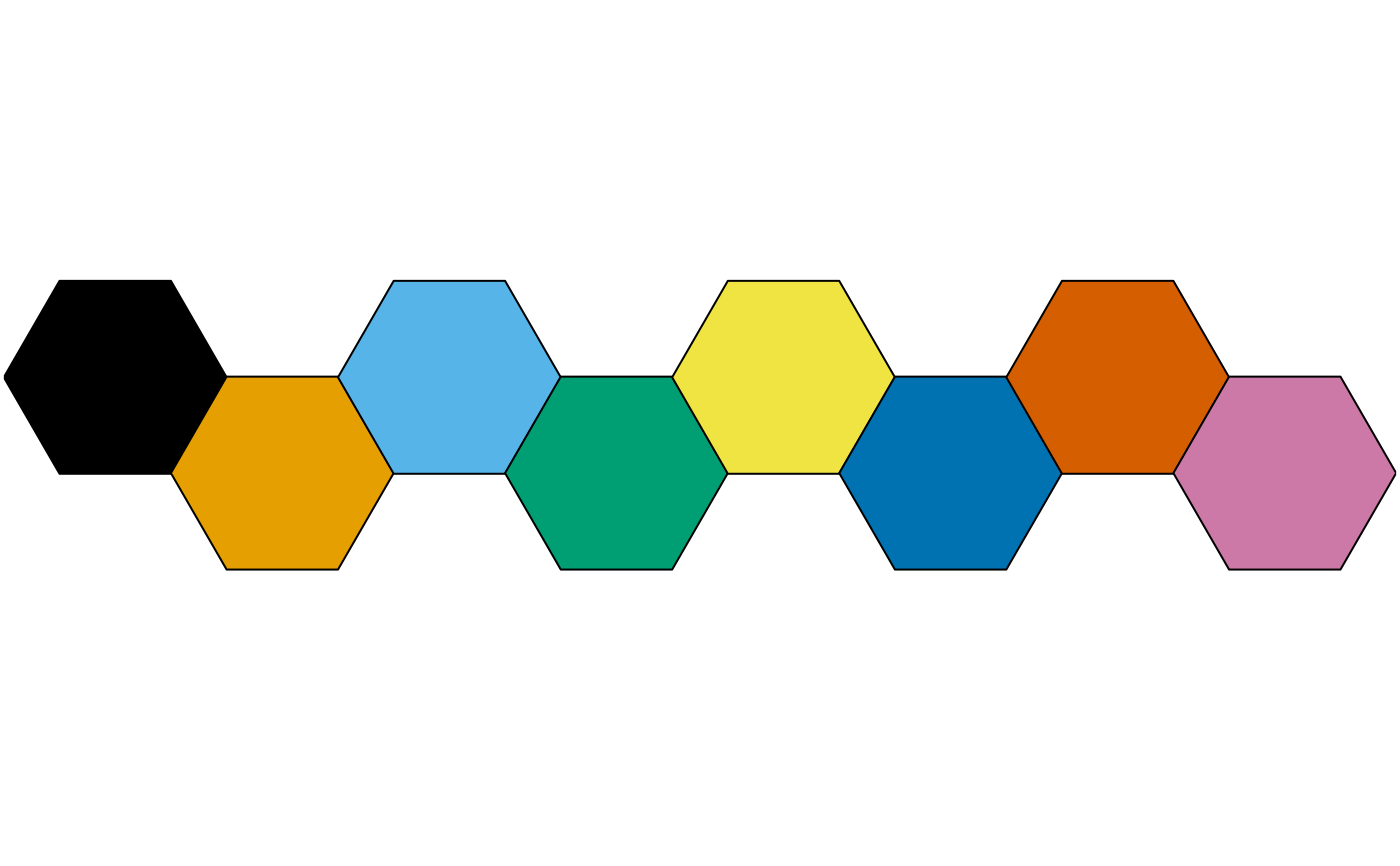
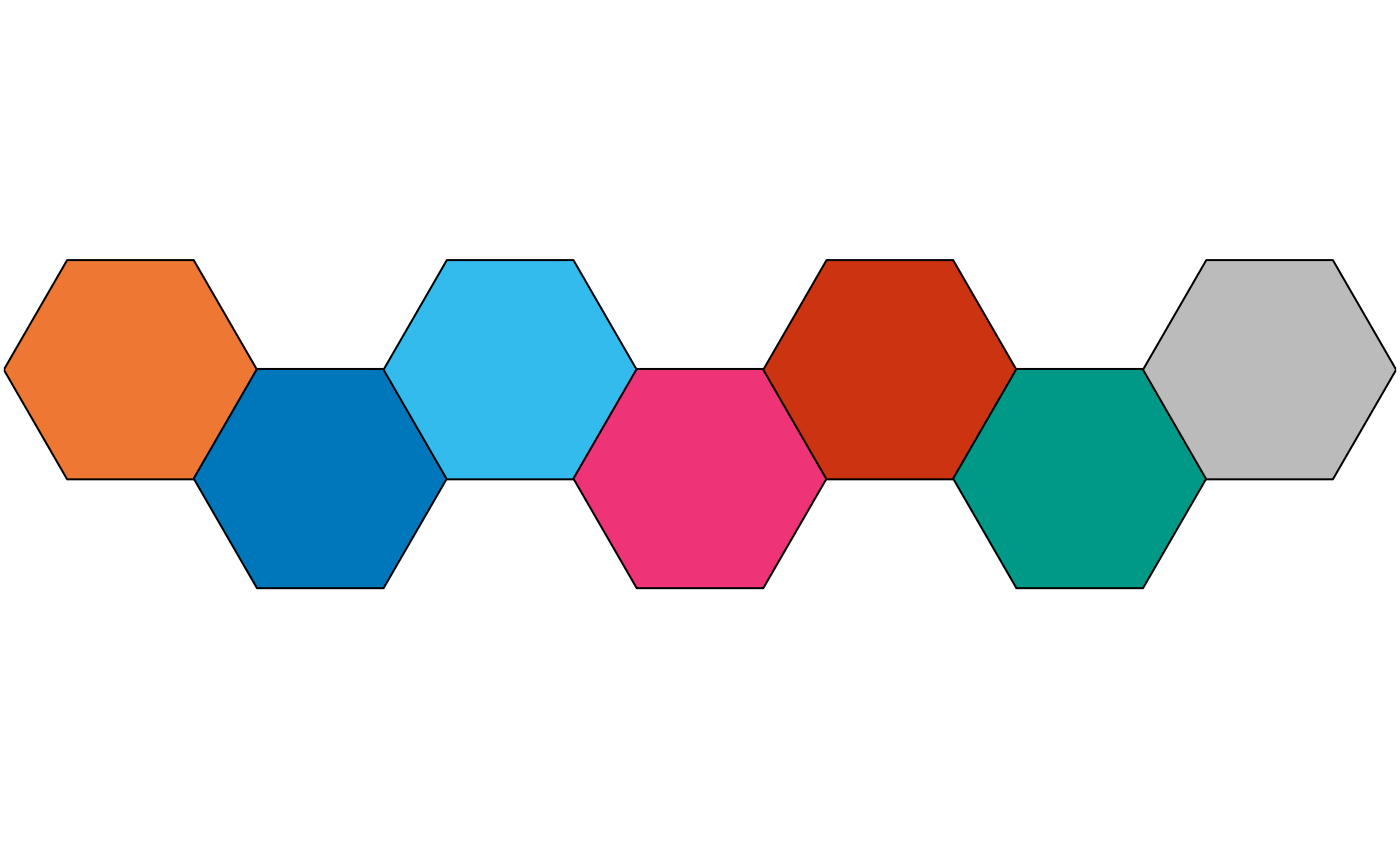
## Okabe and Ito colour scheme
colour("okabe ito")(8)
#> [1] "#000000" "#E69F00" "#56B4E9" "#009E73" "#F0E442" "#0072B2" "#D55E00"
#> [8] "#CC79A7"
#> attr(,"missing")
#> [1] NA
plot_scheme(colour("okabe ito")(8))
 ## Paul Tol's colour schemes
### Qualitative data
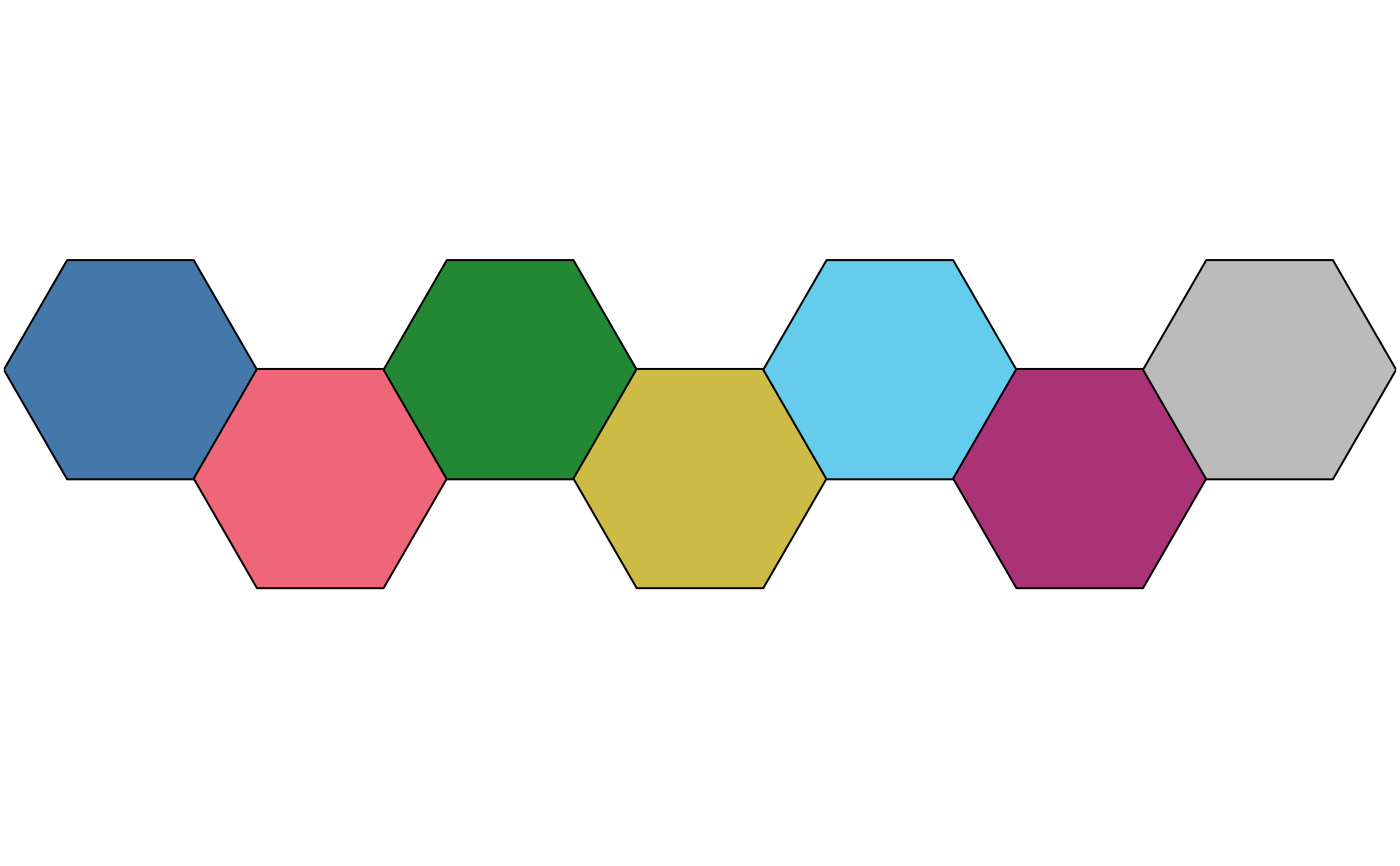
plot_scheme(colour("bright")(7))
## Paul Tol's colour schemes
### Qualitative data
plot_scheme(colour("bright")(7))
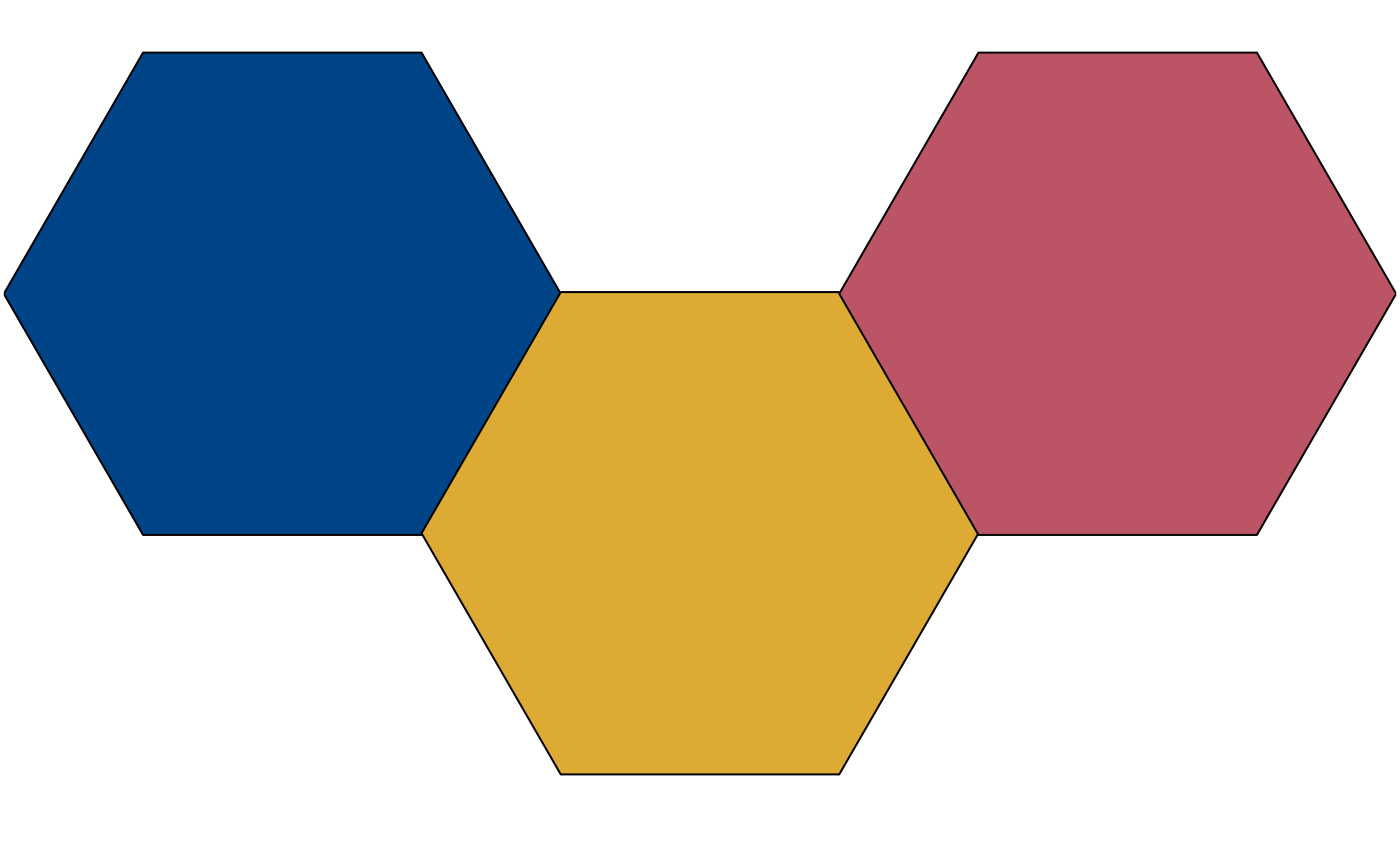
 plot_scheme(colour("high contrast")(3))
 plot_scheme(colour("vibrant")(7))
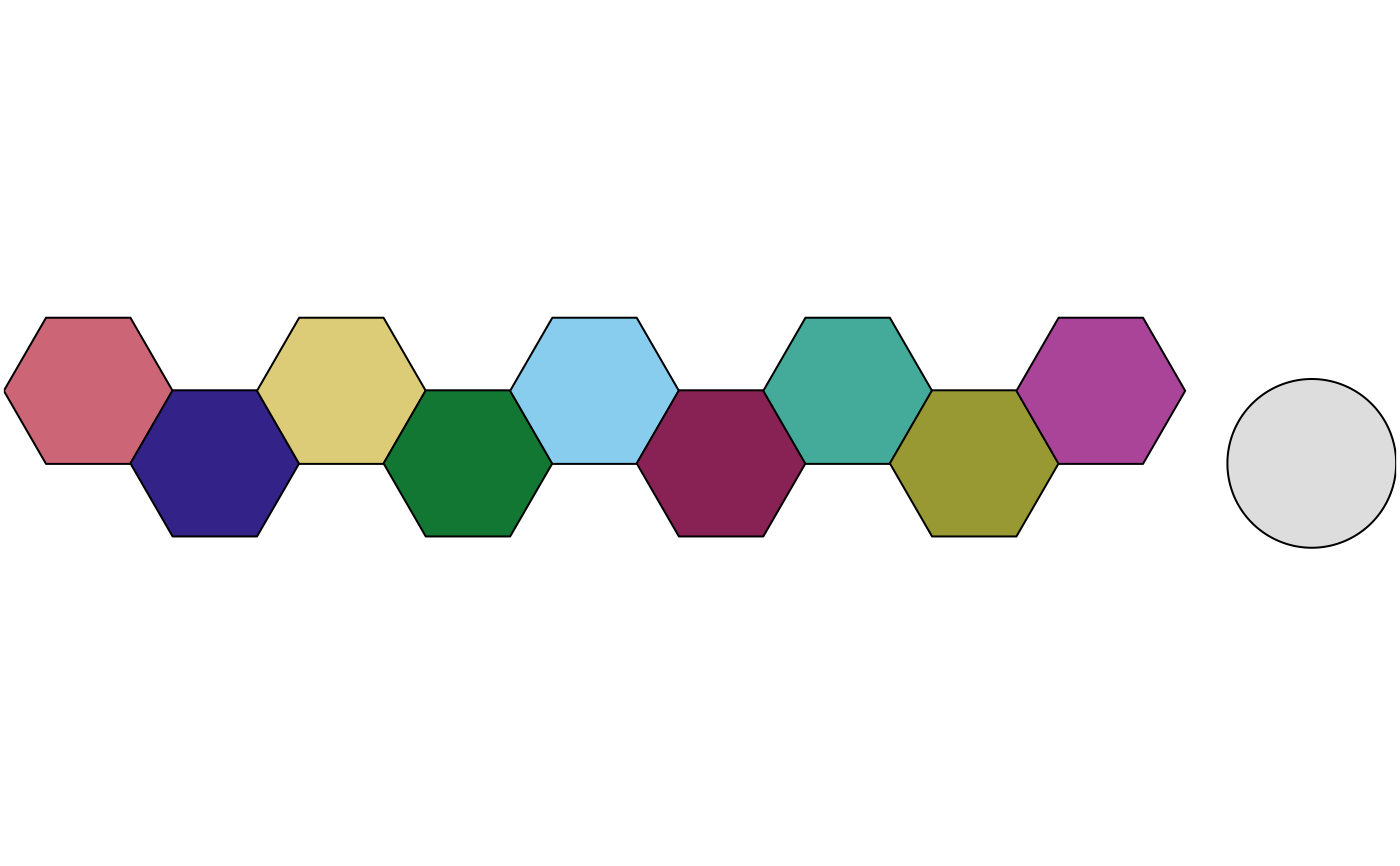
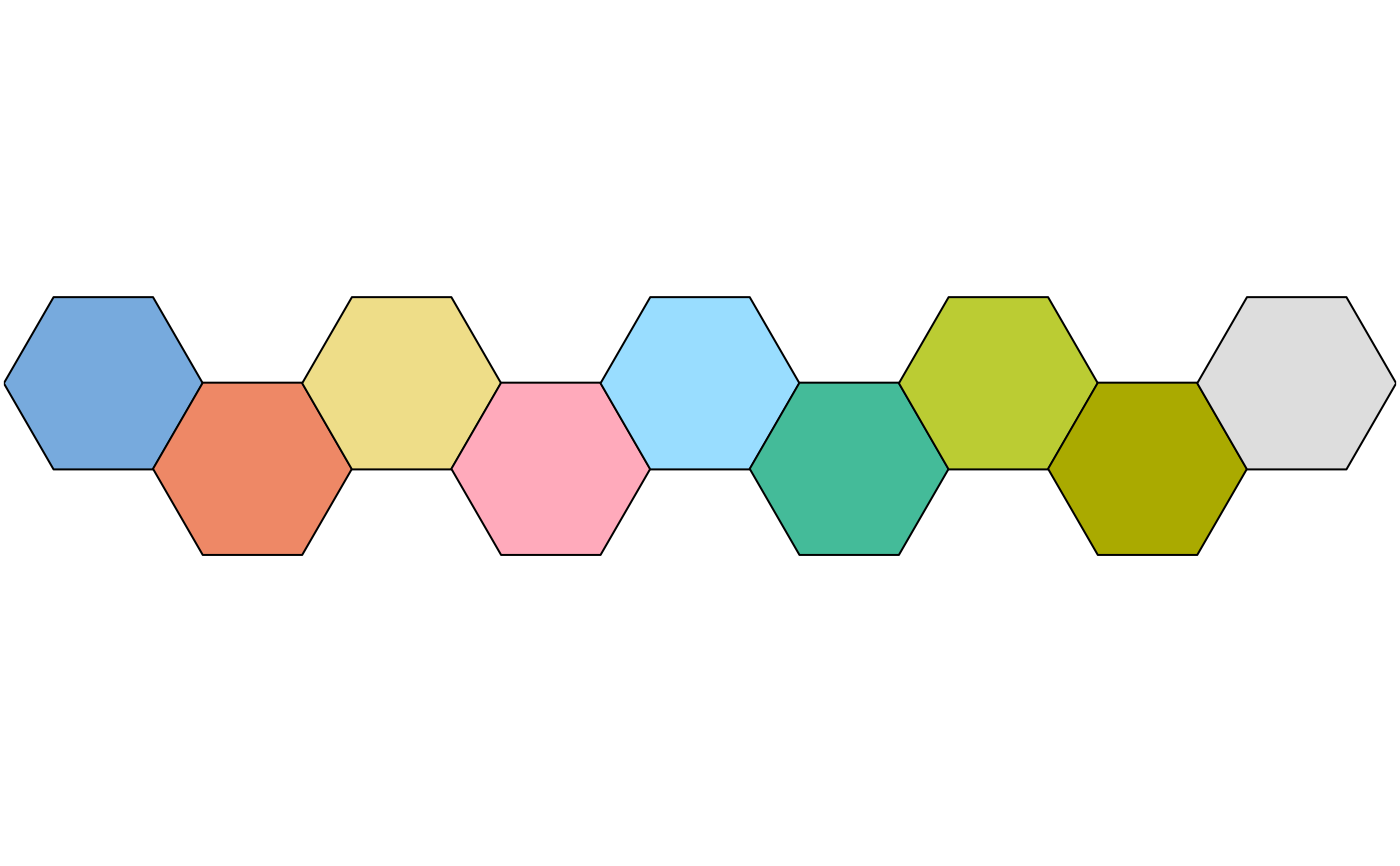
 plot_scheme(colour("muted")(9))
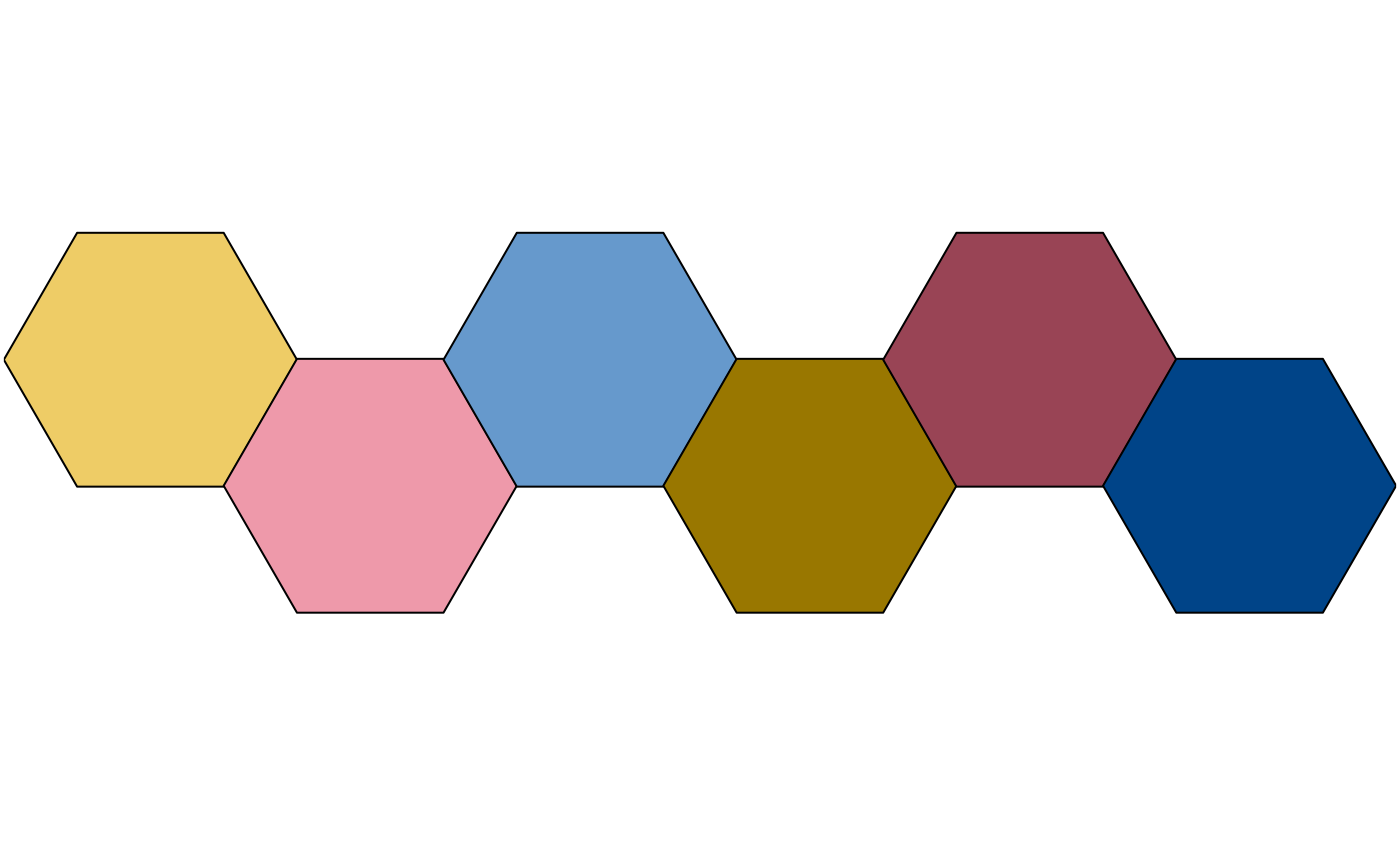
 plot_scheme(colour("medium contrast")(6))
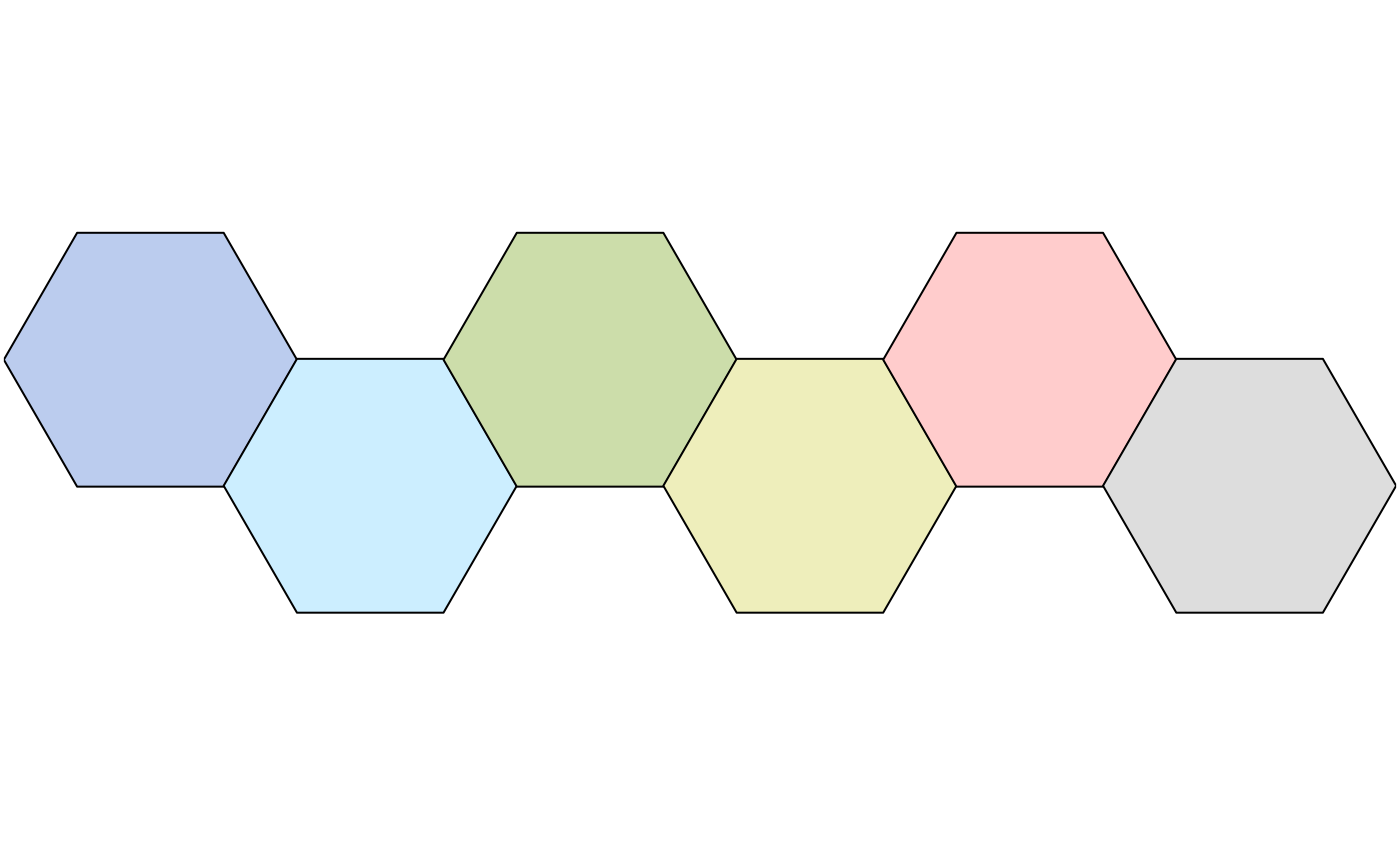
 plot_scheme(colour("pale")(6))
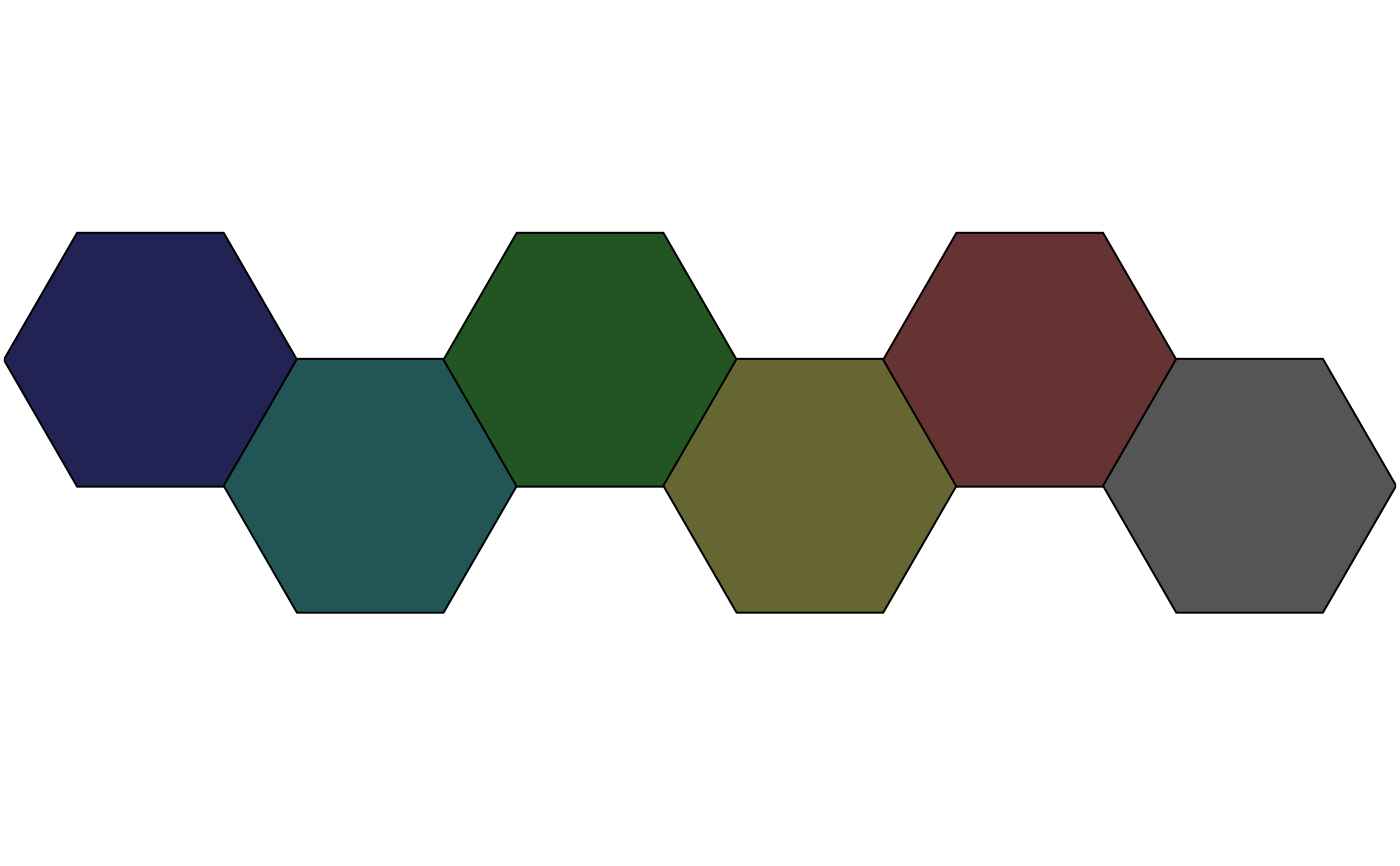
 plot_scheme(colour("dark")(6))
 plot_scheme(colour("light")(9))
 ### Diverging data
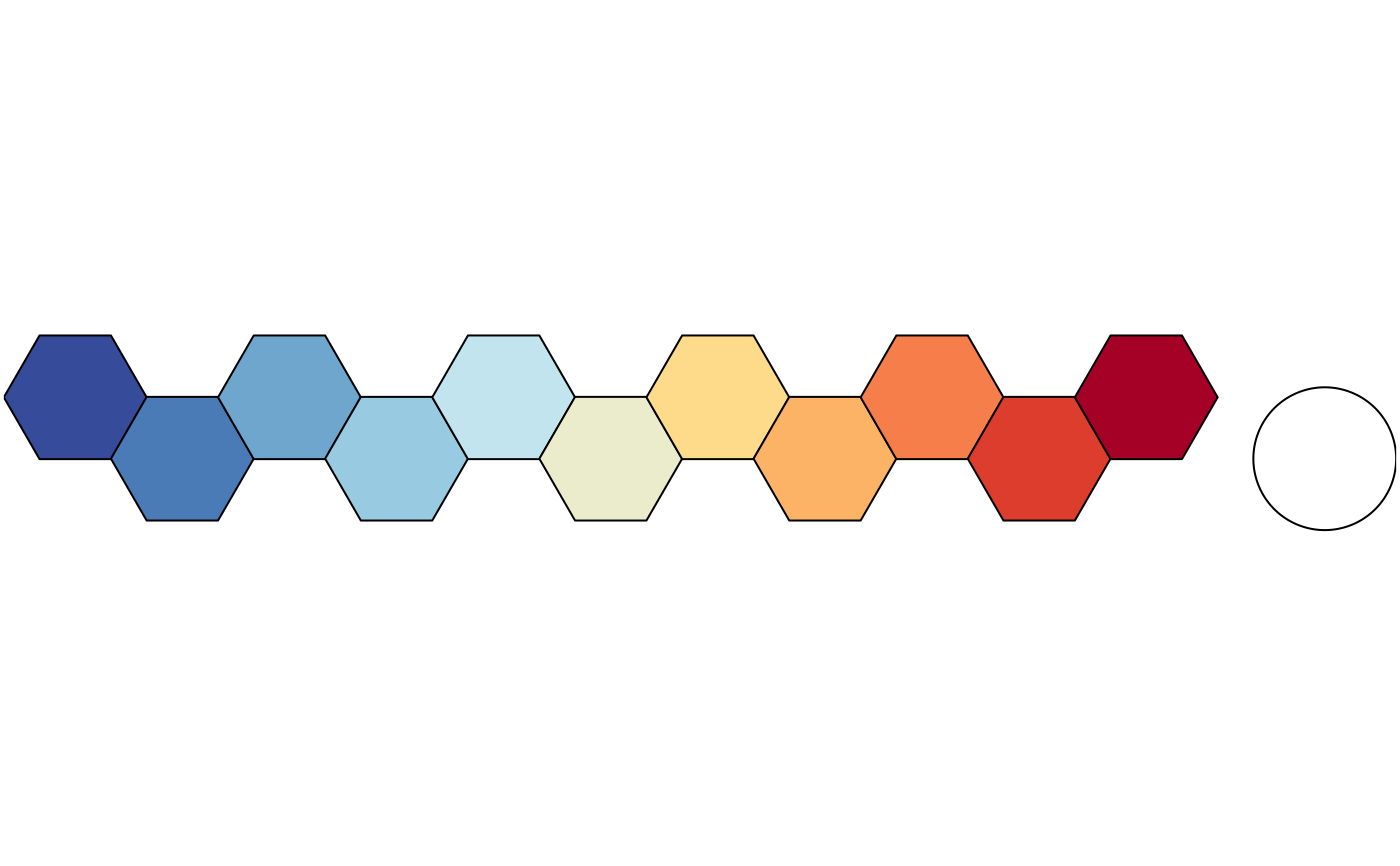
plot_scheme(colour("sunset")(11))
### Diverging data
plot_scheme(colour("sunset")(11))
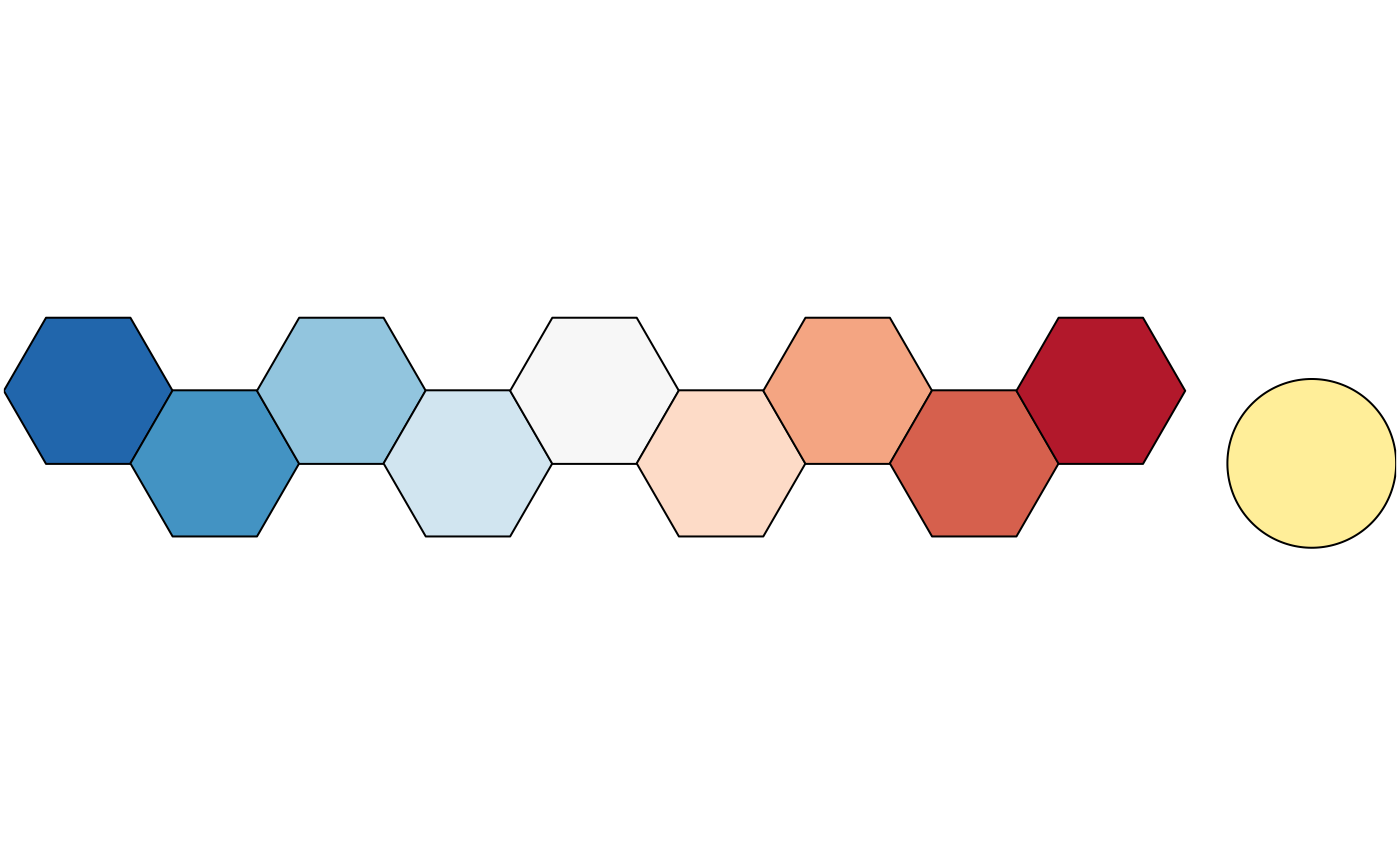
 plot_scheme(colour("BuRd")(9))
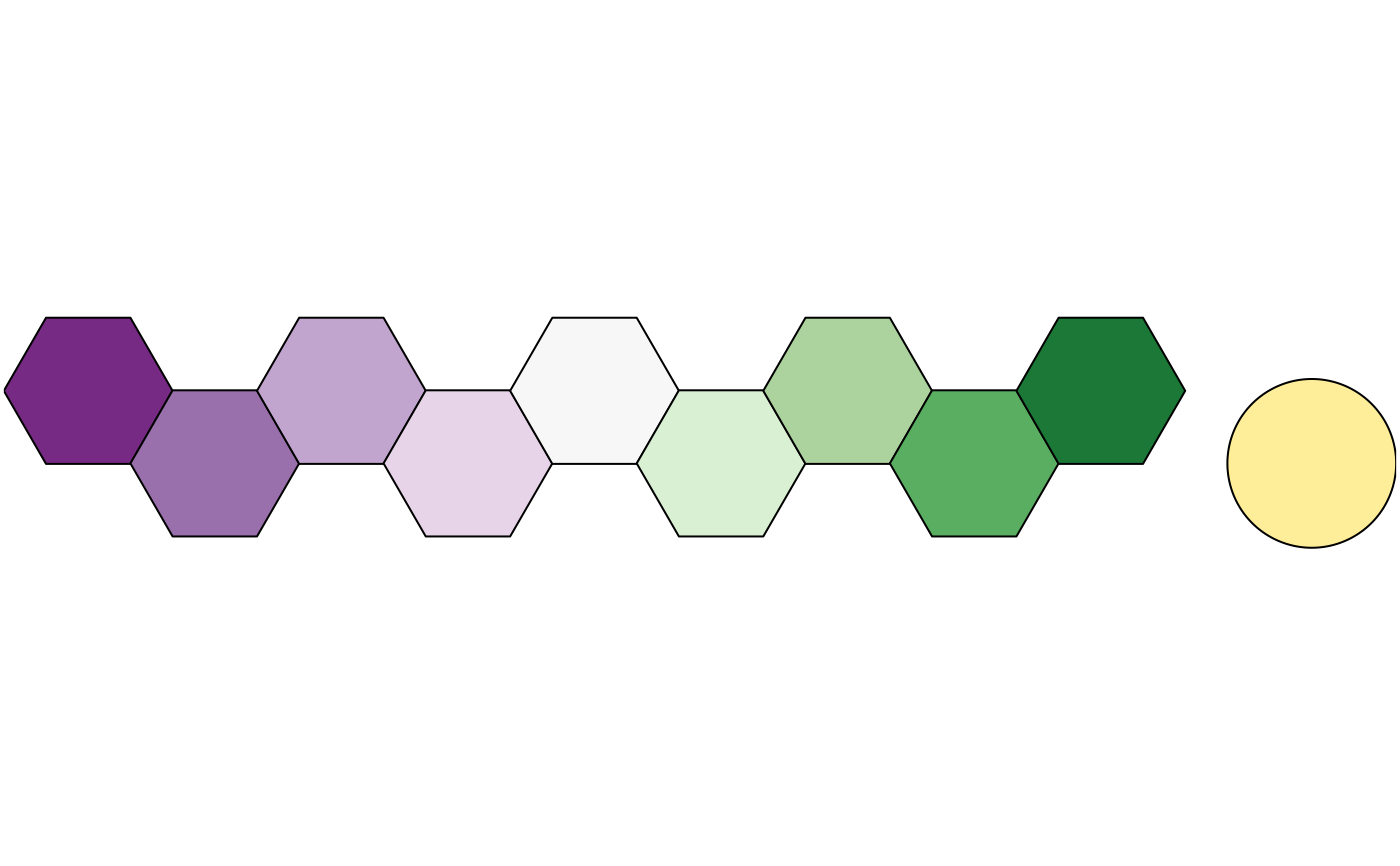
 plot_scheme(colour("PRGn")(9))
 ### Sequential data
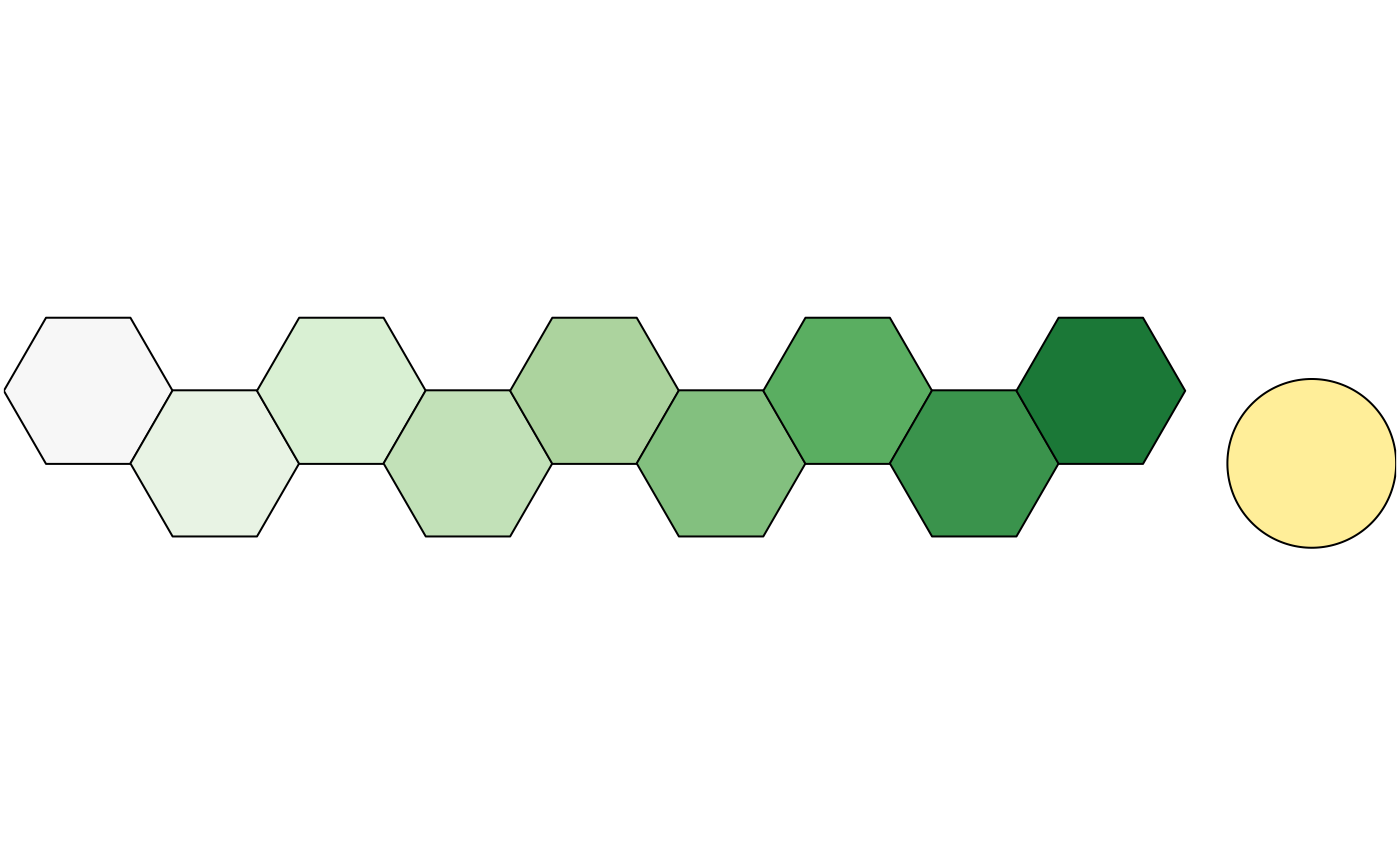
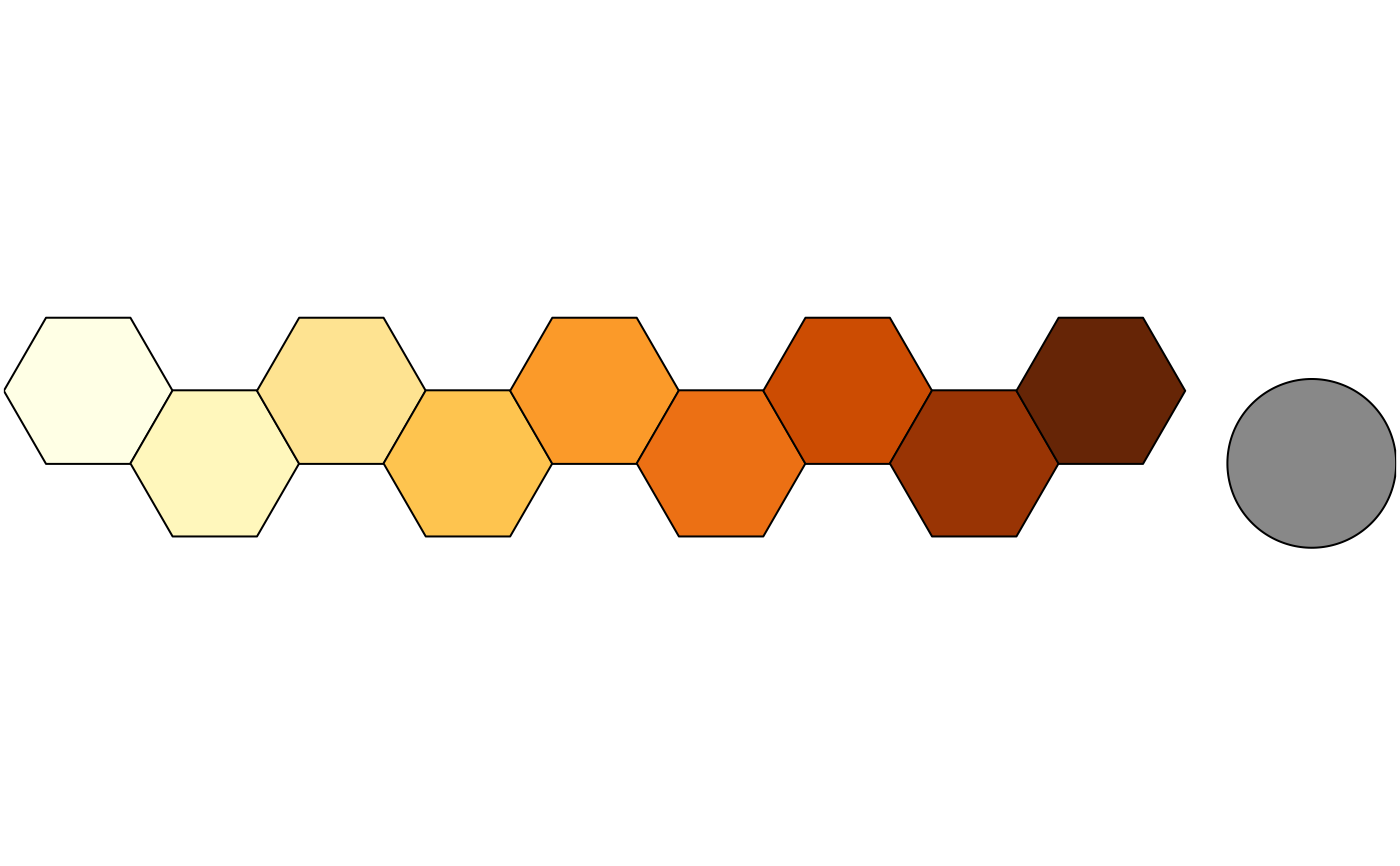
plot_scheme(colour("YlOrBr")(9))
### Sequential data
plot_scheme(colour("YlOrBr")(9))
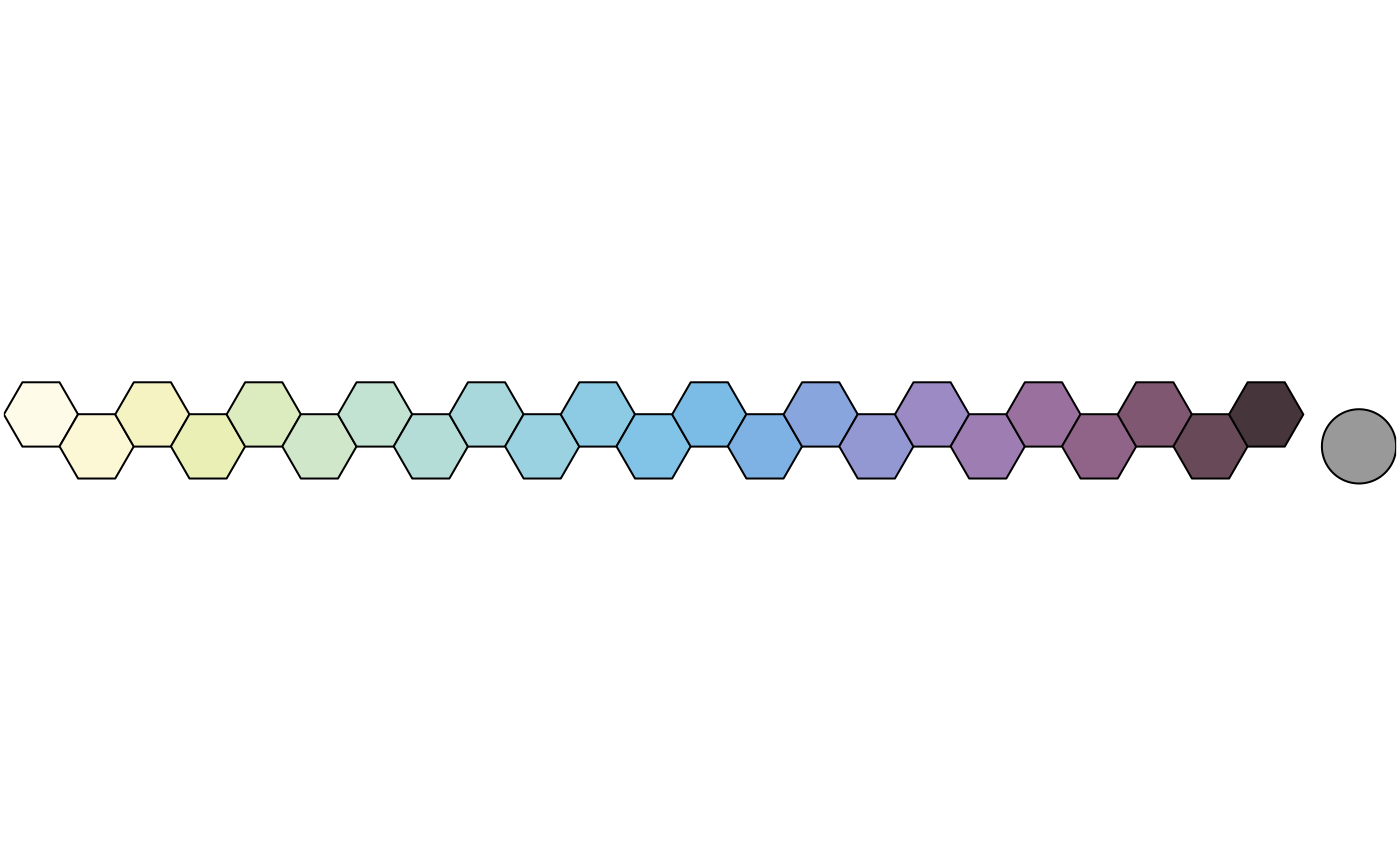
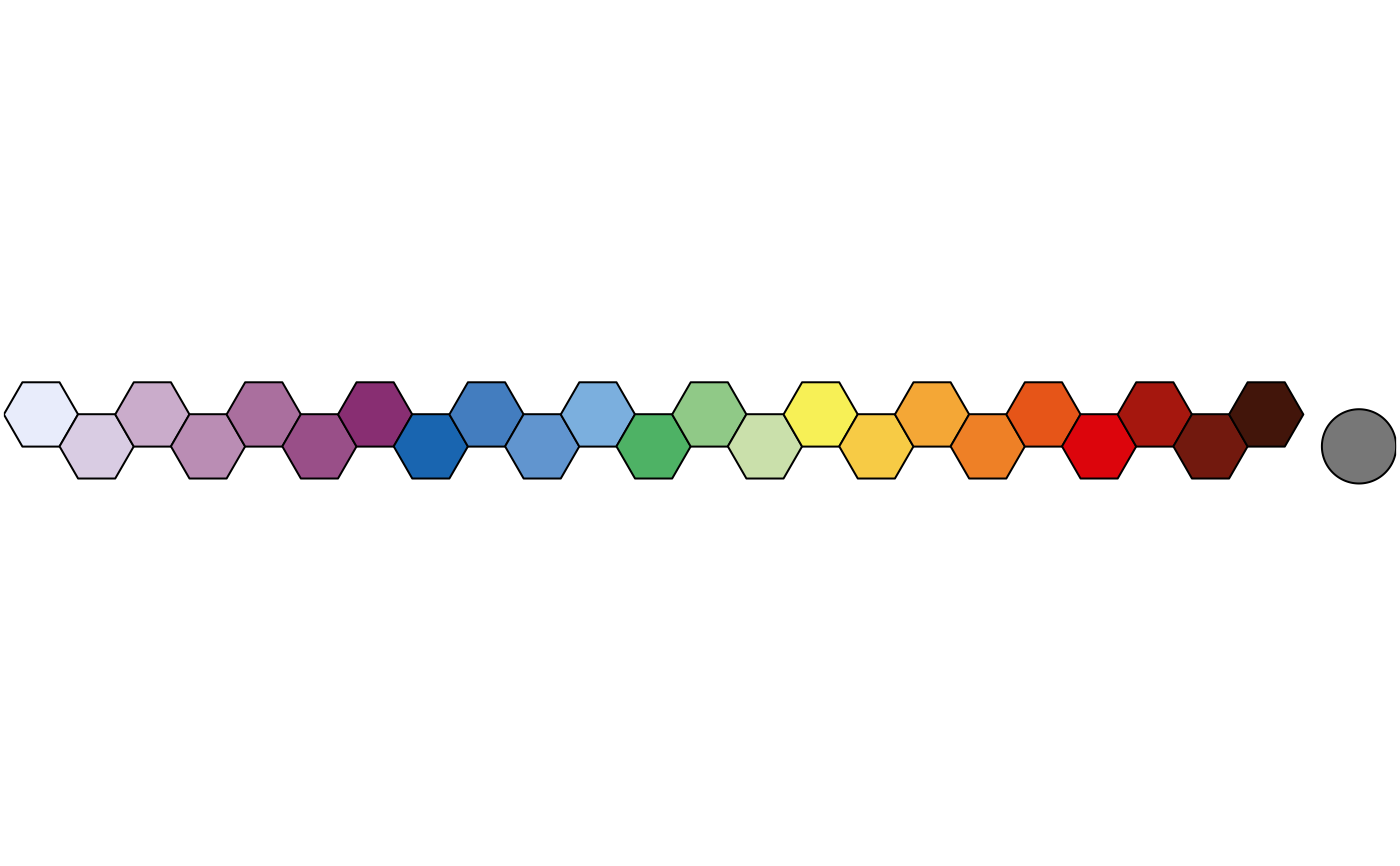
 plot_scheme(colour("iridescent")(23))
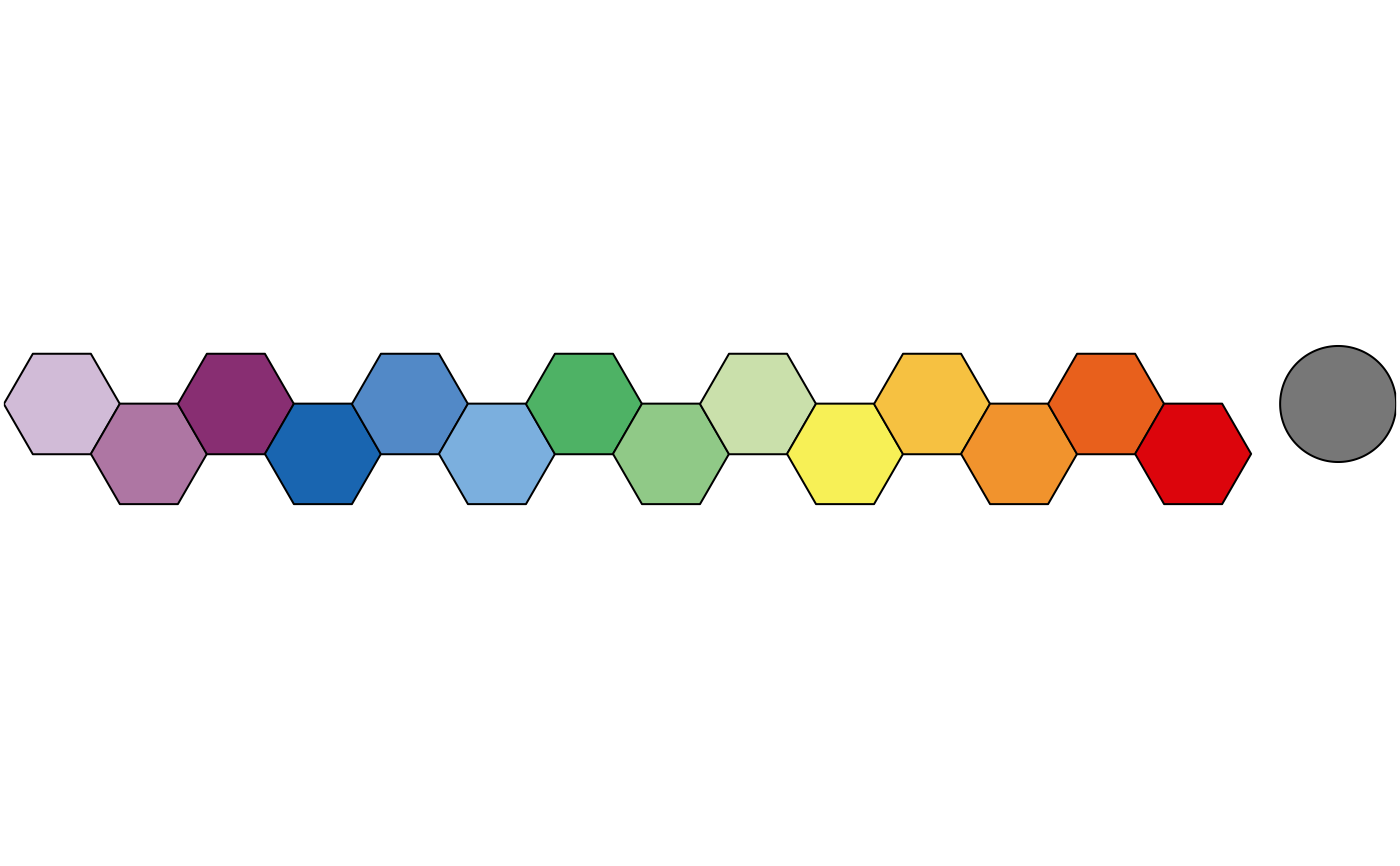
 plot_scheme(colour("discrete rainbow")(14))
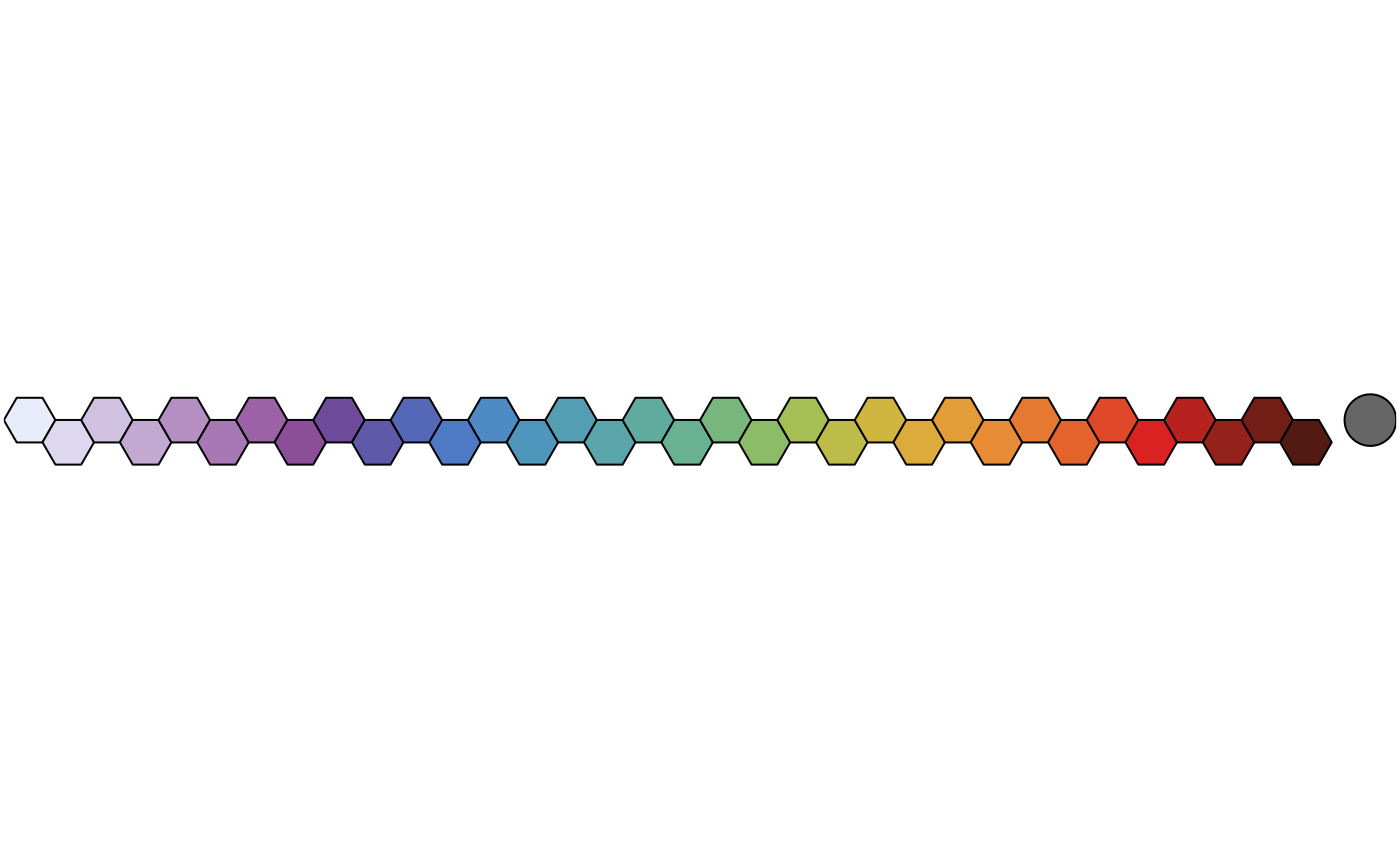
 plot_scheme(colour("discrete rainbow")(23))
 plot_scheme(colour("smooth rainbow")(34))
 ## Scientific colour schemes
### Geologic timescale
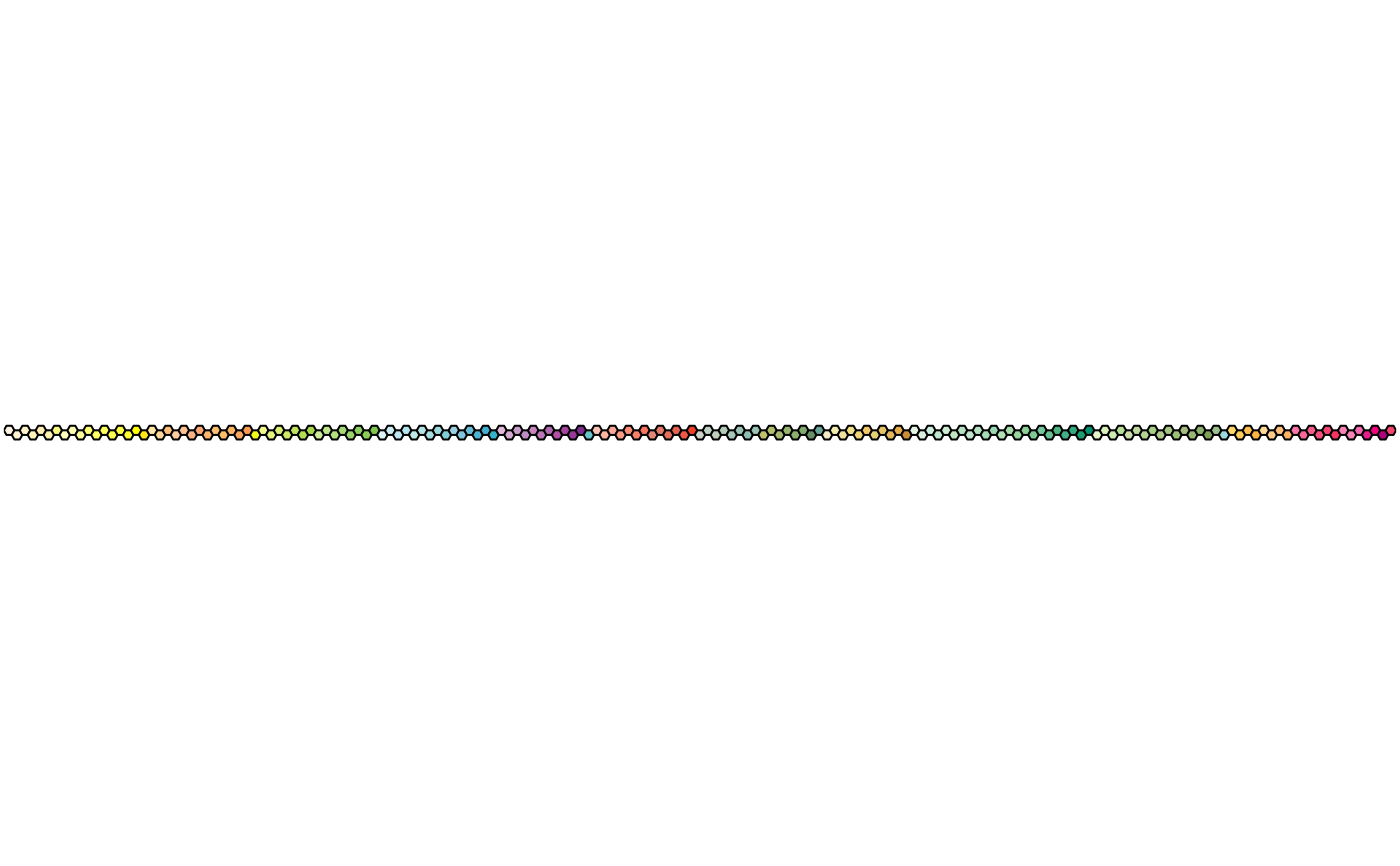
plot_scheme(colour("stratigraphy")(175))
## Scientific colour schemes
### Geologic timescale
plot_scheme(colour("stratigraphy")(175))
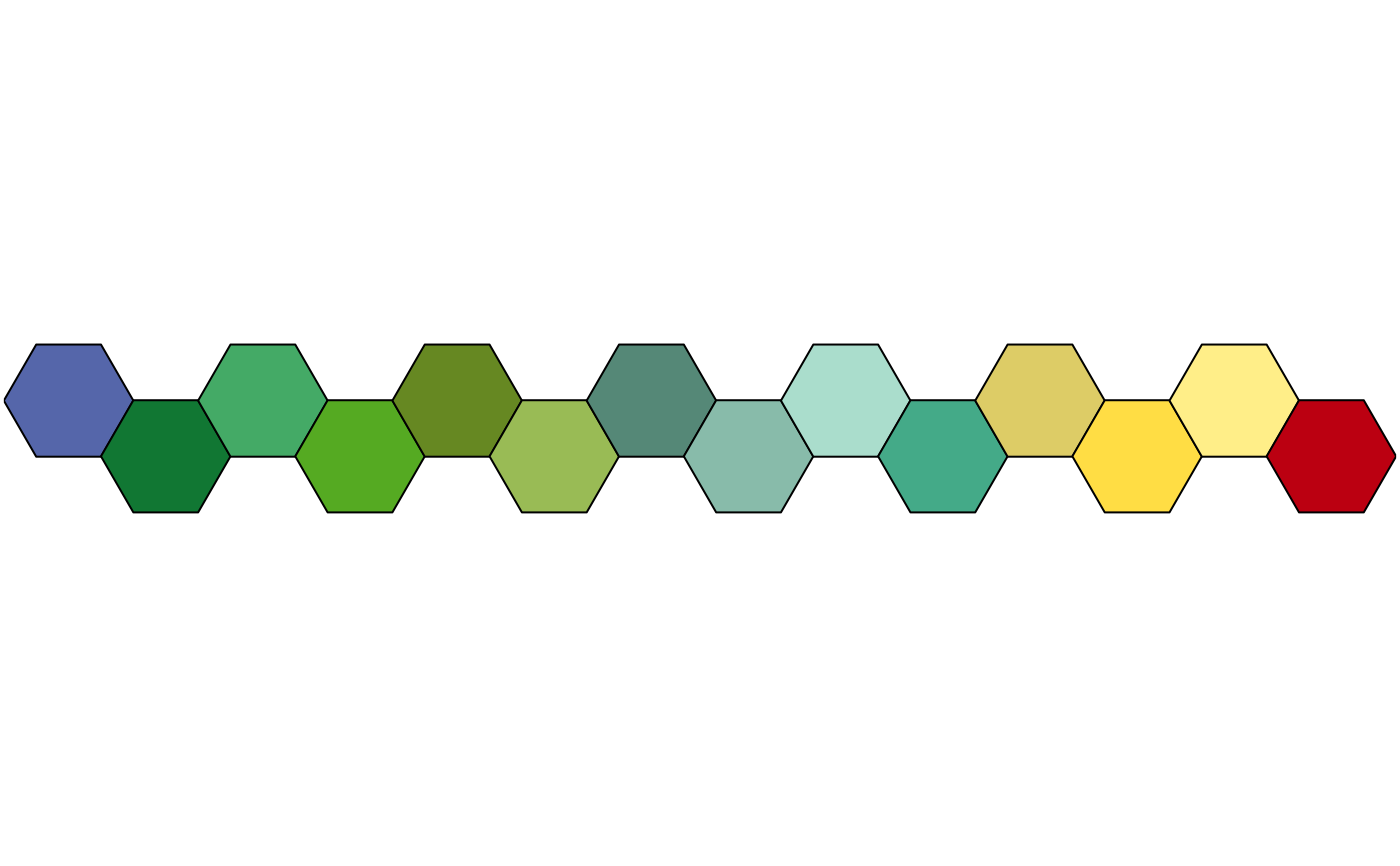
 ### AVHRR global land cover classification
plot_scheme(colour("land")(14))
### AVHRR global land cover classification
plot_scheme(colour("land")(14))
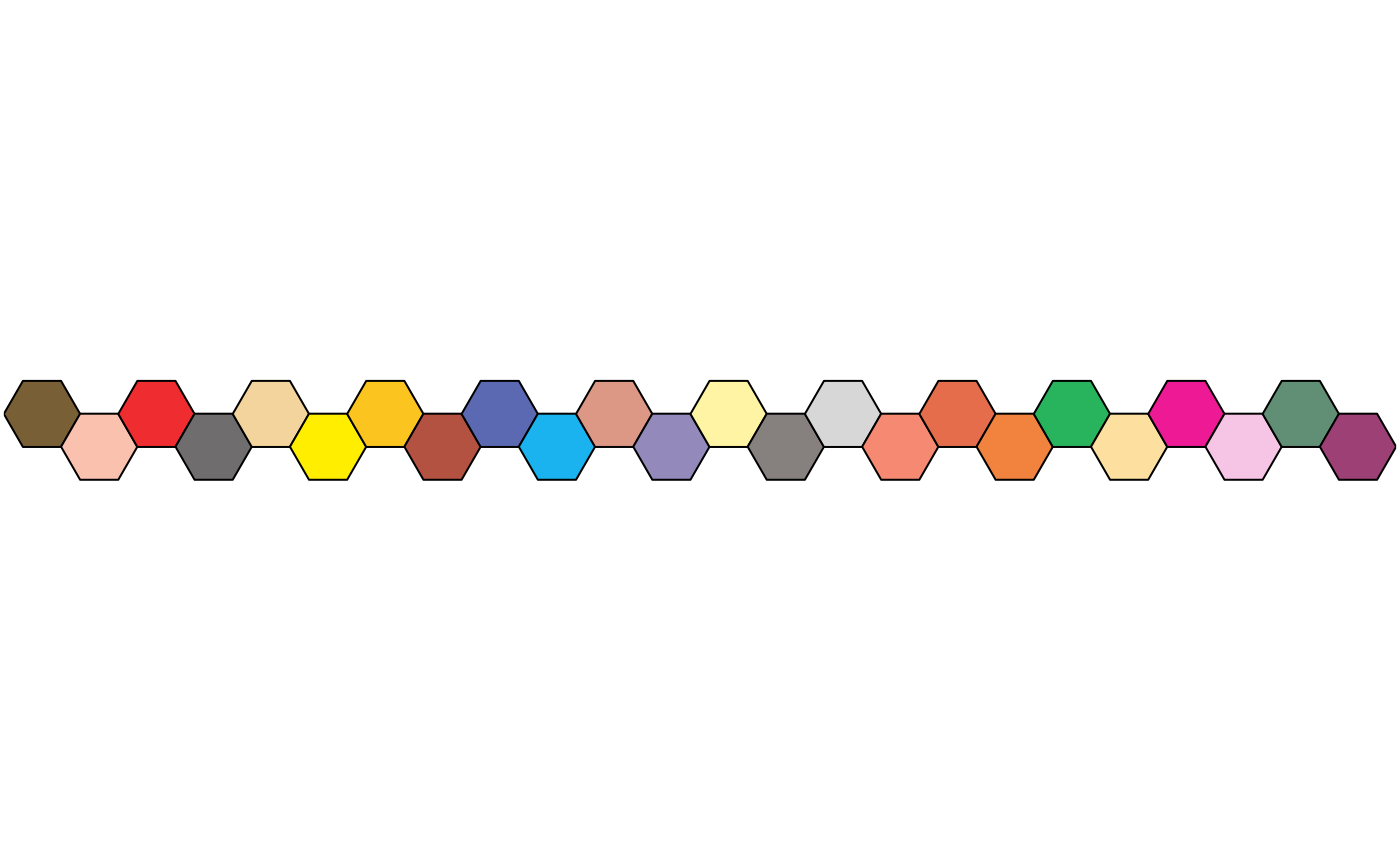
 ### FAO soil reference groups
plot_scheme(colour("soil")(24))
### FAO soil reference groups
plot_scheme(colour("soil")(24))
 ## Adjust colour levels
PRGn <- colour("PRGn")
plot_scheme(PRGn(9, range = c(0.5, 1)))
## Adjust colour levels
PRGn <- colour("PRGn")
plot_scheme(PRGn(9, range = c(0.5, 1)))