Shows colors in a plot.
Arguments
- x
A
charactervector of colors.- colours
A
logicalscalar: should the hexadecimal representation of the colors be displayed?- names
A
logicalscalar: should the name of the colors be displayed?- size
A
numericvalue giving the amount by which plotting text should be magnified relative to the default. Works the same ascexparameter ofgraphics::par().
Value
plot_scheme() is called for its side-effects: it results in a graphic
being displayed (invisibly returns x).
See also
Other diagnostic tools:
change(),
compare(),
plot.color_scheme(),
plot_map(),
plot_scheme_colourblind(),
plot_tiles()
Examples
plot(colour("bright")(7))
 plot(colour("smooth rainbow")(256))
 ## Plot colour schemes
plot_scheme(colour("bright")(7))
## Plot colour schemes
plot_scheme(colour("bright")(7))
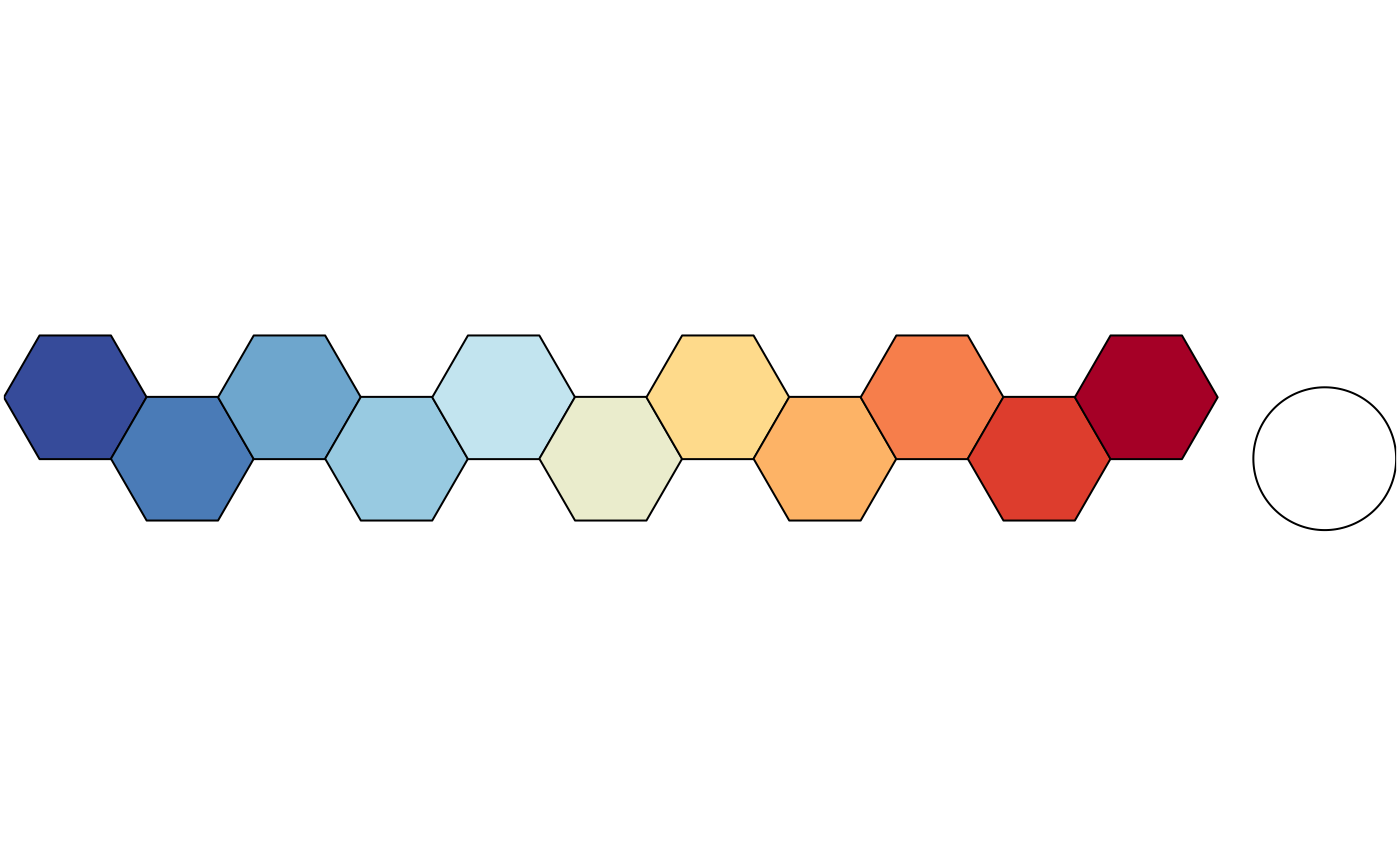
 plot_scheme(colour("sunset")(11))
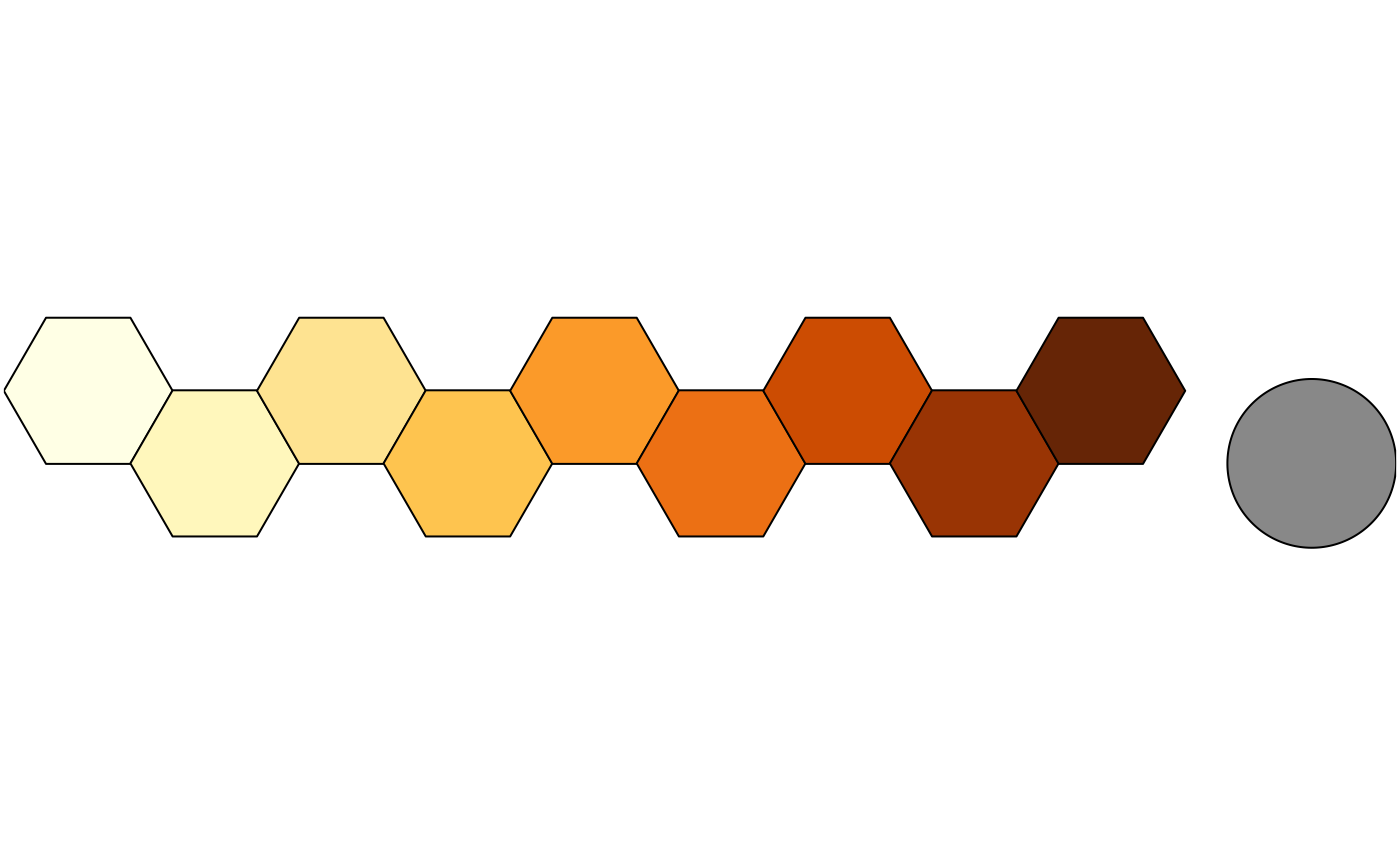
 plot_scheme(colour("YlOrBr")(9))
 plot_scheme(colour("discrete rainbow")(14))
 ## Plot diagnostic maps
plot_map(colour("bright")(7))
## Plot diagnostic maps
plot_map(colour("bright")(7))
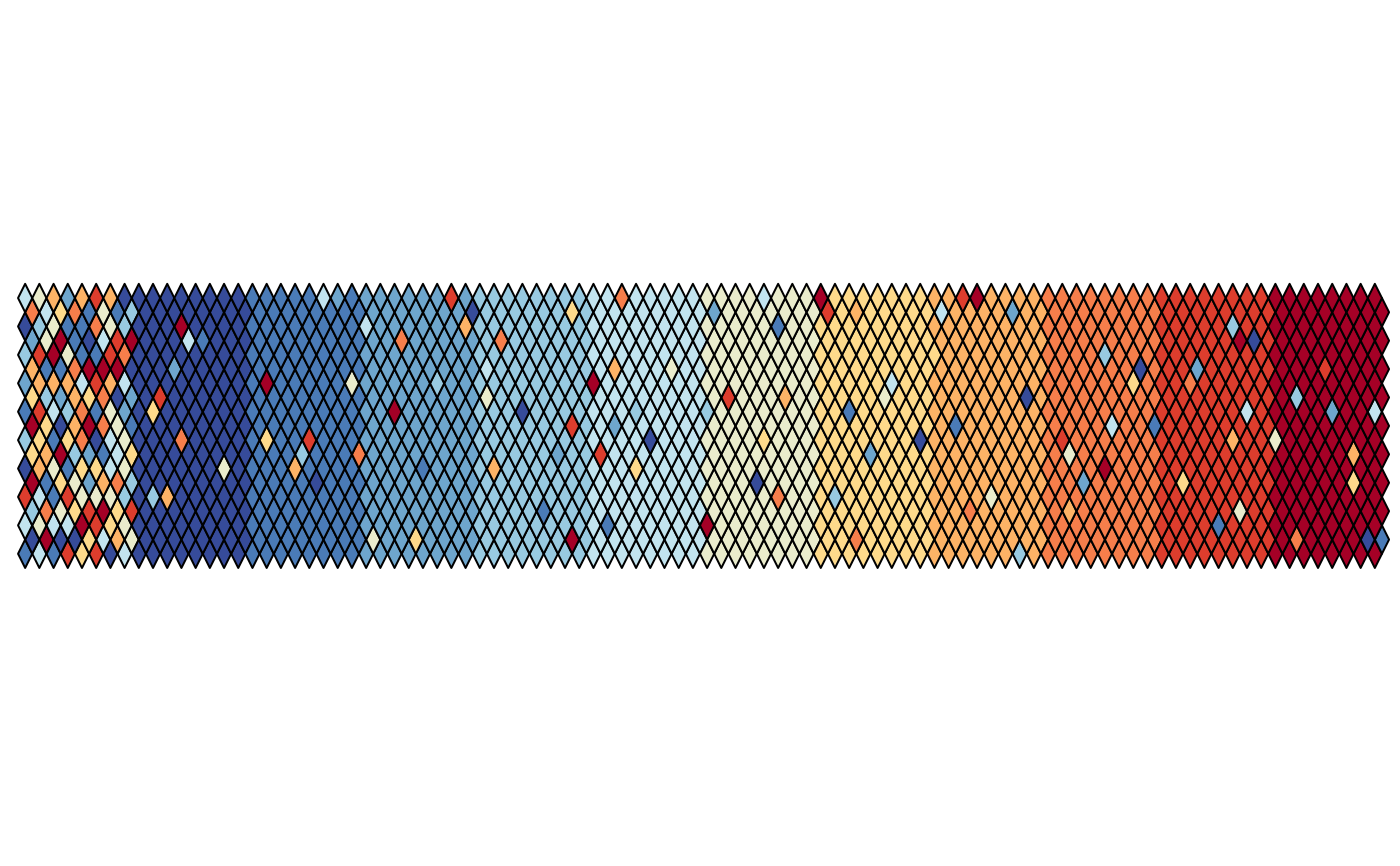
 plot_map(colour("sunset")(11))
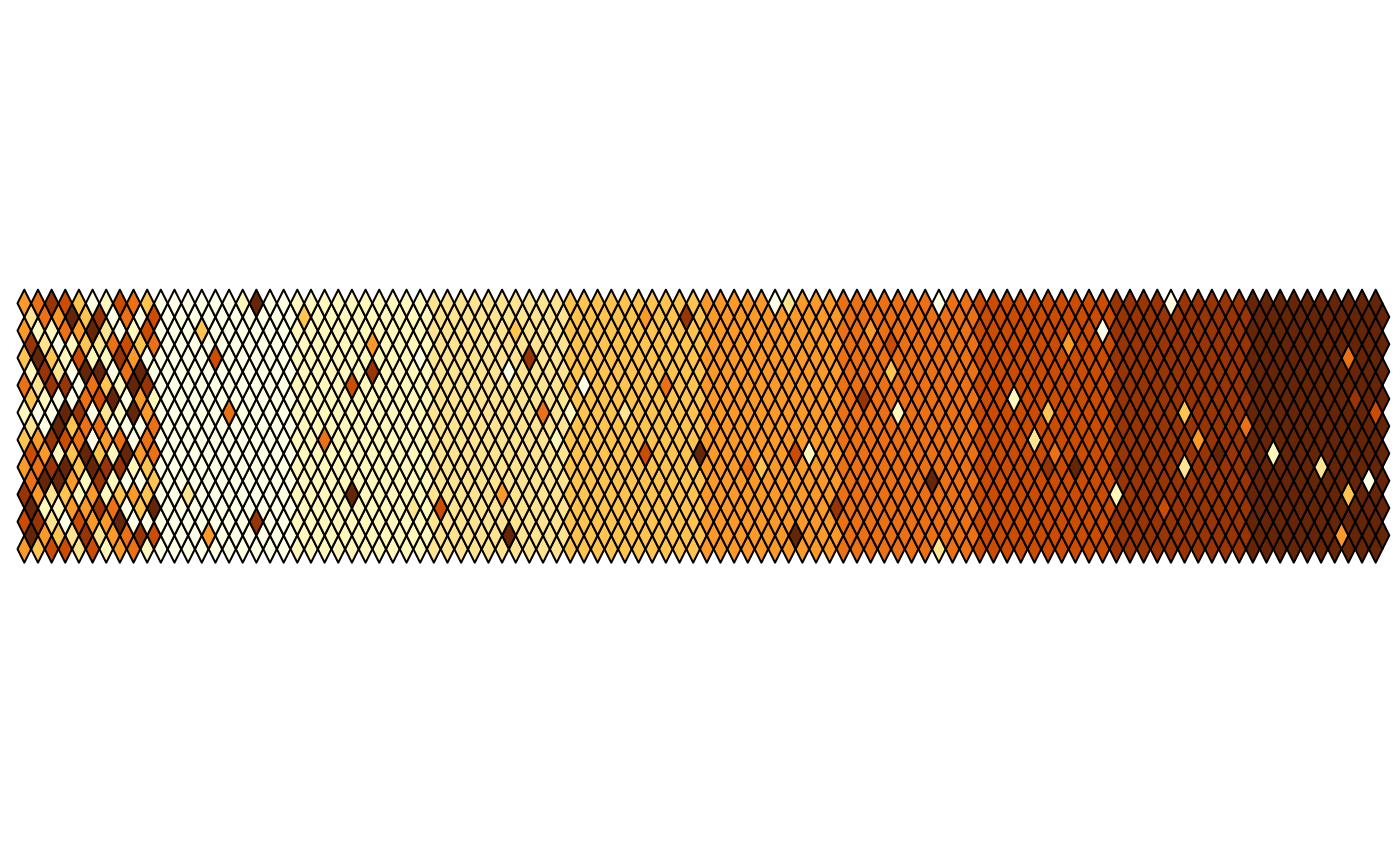
 plot_map(colour("YlOrBr")(9))
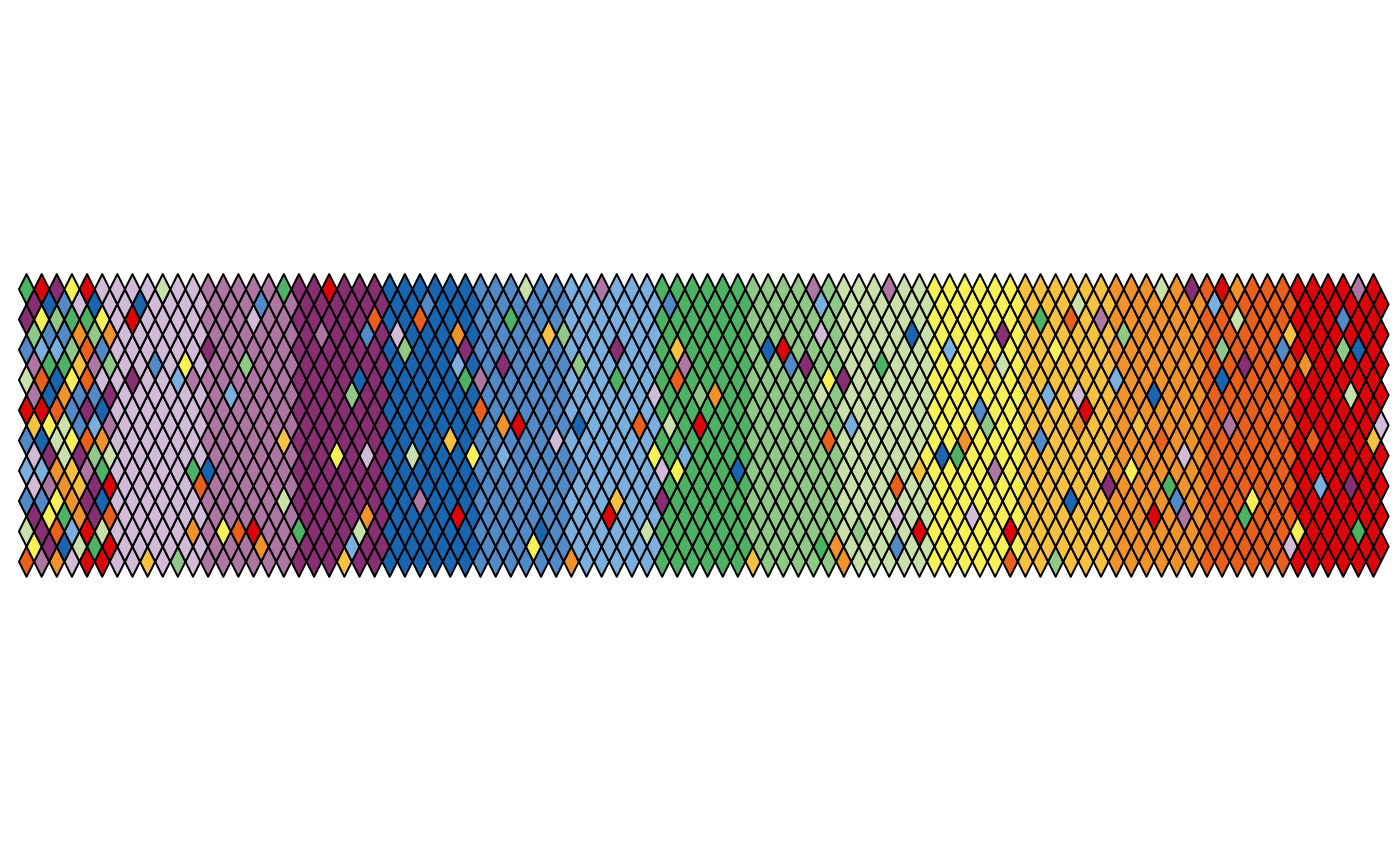
 plot_map(colour("discrete rainbow")(14))
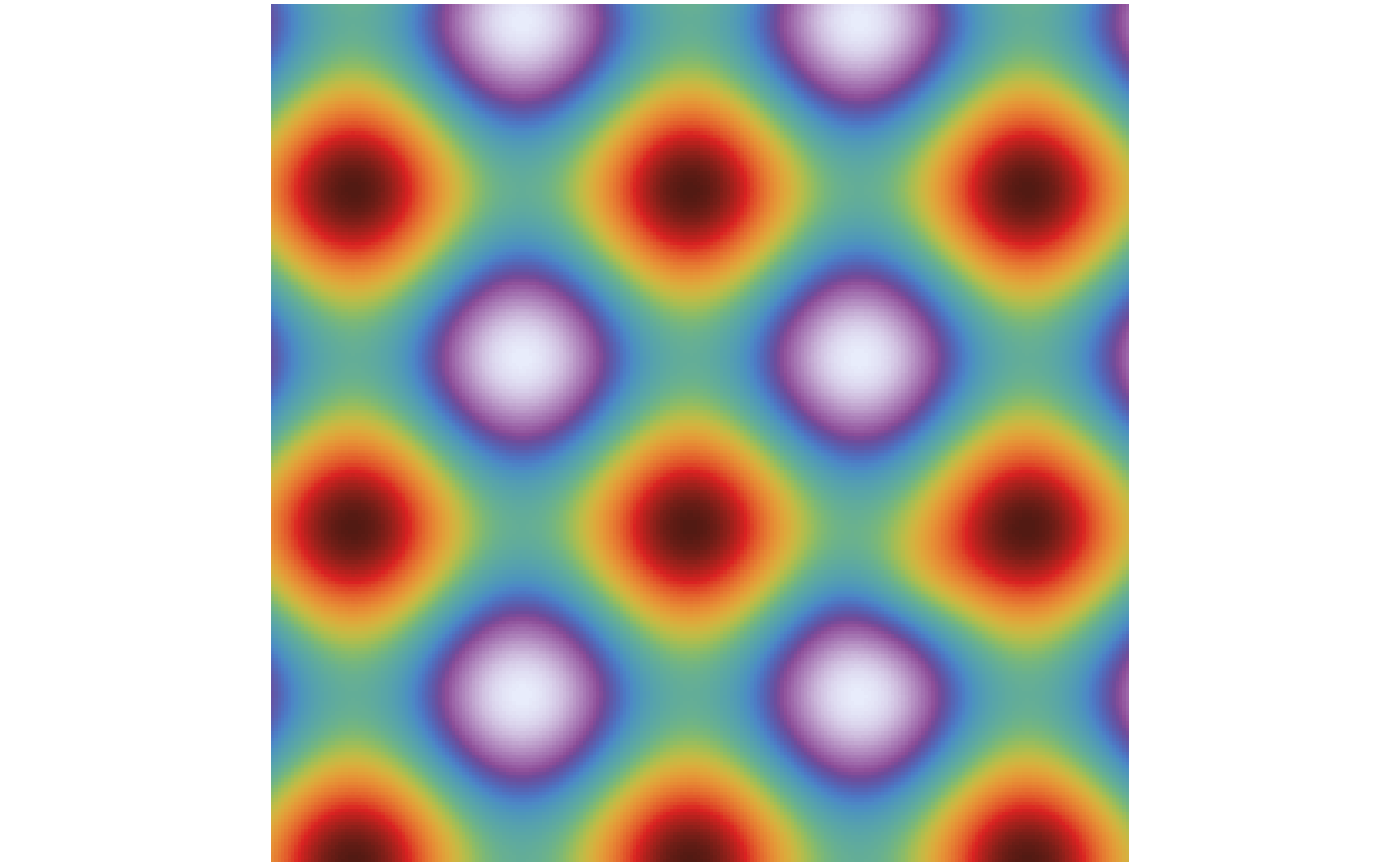
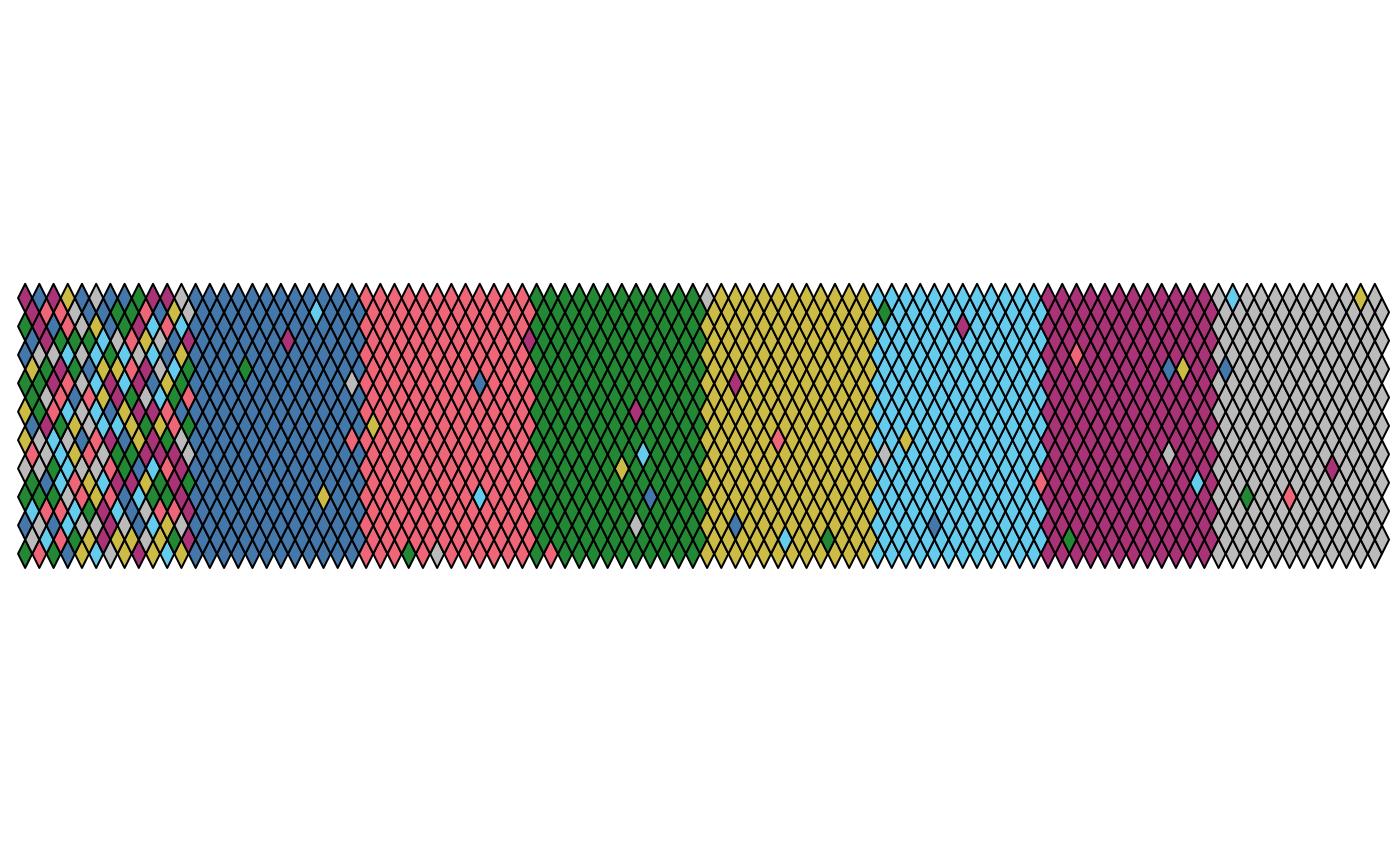
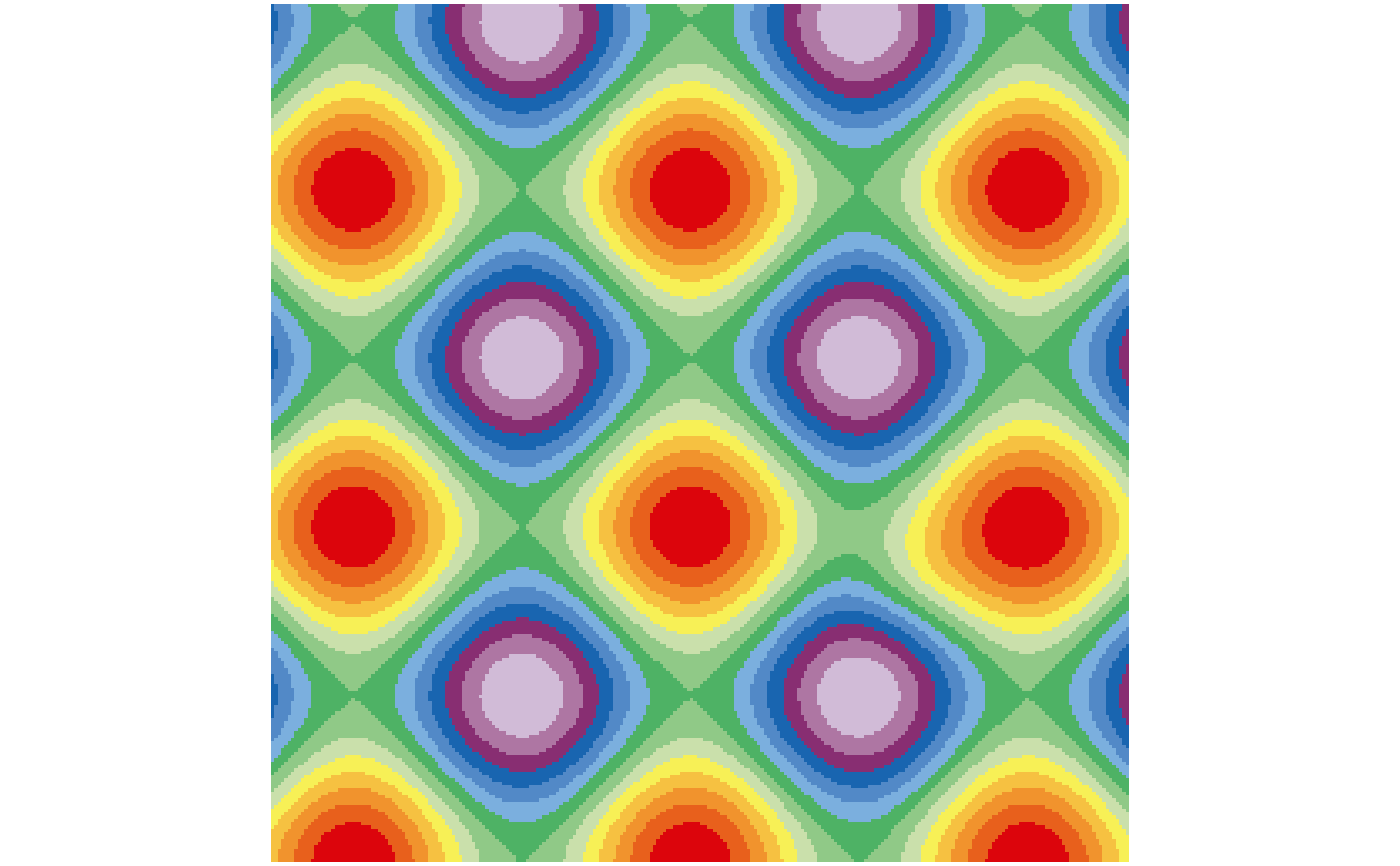
 ## Plot diagnostic images
plot_tiles(colour("discrete rainbow")(14), n = 256)
## Plot diagnostic images
plot_tiles(colour("discrete rainbow")(14), n = 256)
 plot_tiles(colour("discrete rainbow")(23), n = 256)
 plot_tiles(colour("smooth rainbow")(256), n = 256)