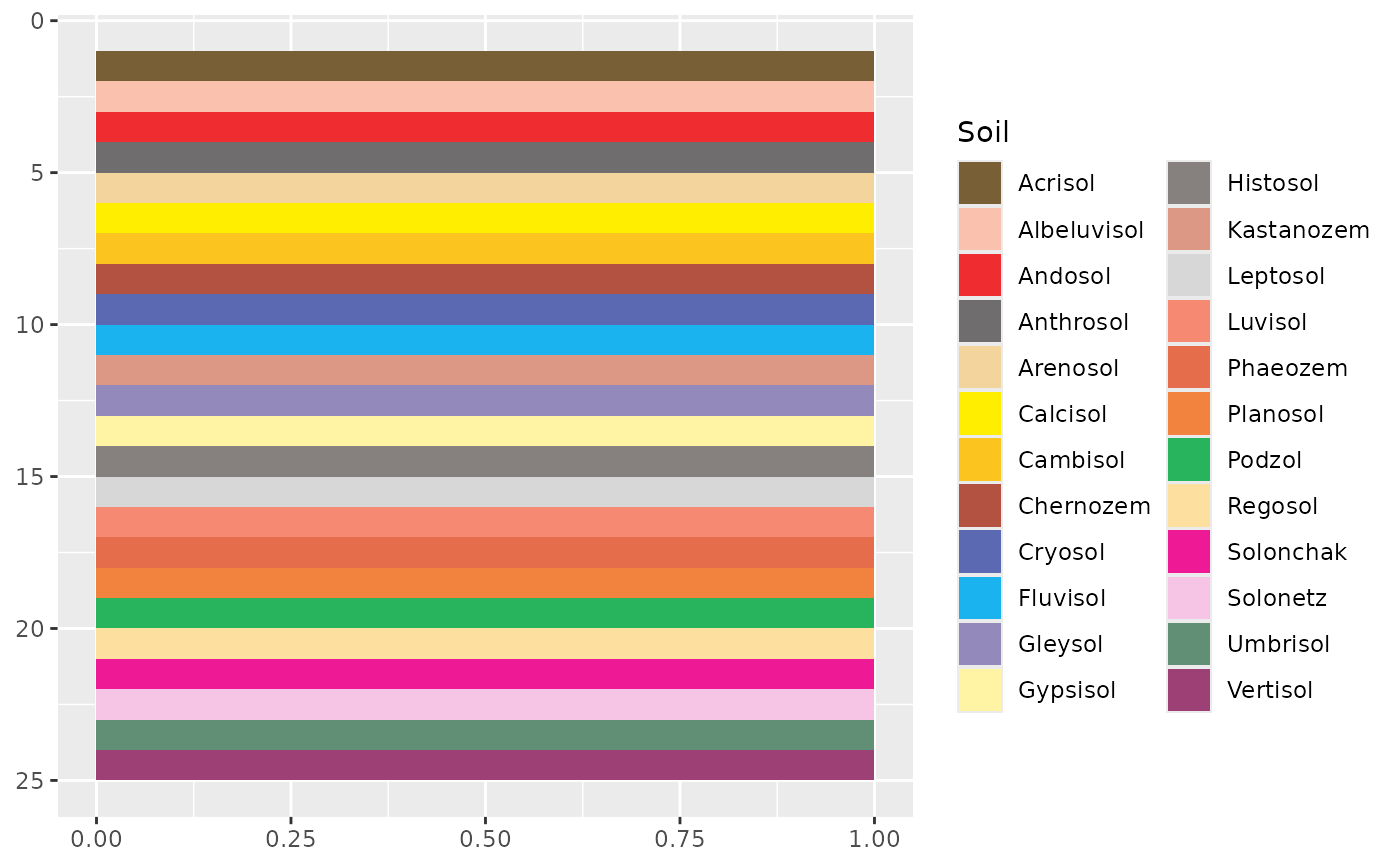
FAO Soil Reference Groups Color Scheme for ggplot2 and ggraph
Source:R/scale_colour_science.R
scale_soil.RdProvides the FAO Soil Reference Groups color scheme.
Usage
scale_colour_soil(..., lang = "en", aesthetics = "colour")

scale_color_soil(..., lang = "en", aesthetics = "colour")

scale_fill_soil(..., lang = "en", aesthetics = "fill")

scale_edge_colour_soil(..., lang = "en")

scale_edge_color_soil(..., lang = "en")

scale_edge_fill_soil(..., lang = "en")
Arguments
- ...
Arguments passed on to
ggplot2::discrete_scale().- lang
A
characterstring specifying the language for the color names (see details). It must be one of "en" (english, the default), "fr" (french) orNULL. If notNULL, the values will be matched based on the color names.- aesthetics
A
characterstring or vector of character strings listing the name(s) of the aesthetic(s) that this scale works with.
Value
A discrete scale.
References
Jones, A., Montanarella, L. & Jones, R. (Ed.) (2005). Soil atlas of Europe. Luxembourg: European Commission, Office for Official Publications of the European Communities. 128 pp. ISBN: 92-894-8120-X.
See also
Other themed color schemes:
scale_colour_land(),
scale_colour_stratigraphy()
Other qualitative color schemes:
scale_colour_land(),
scale_colour_stratigraphy(),
scale_okabeito_discrete,
scale_tol_bright,
scale_tol_dark,
scale_tol_discreterainbow,
scale_tol_highcontrast,
scale_tol_light,
scale_tol_mediumcontrast,
scale_tol_muted,
scale_tol_pale,
scale_tol_vibrant
Examples
library(ggplot2)

soil <- data.frame(
  name = c(
    "Acrisol", "Albeluvisol", "Andosol", "Anthrosol", "Arenosol", "Calcisol",
    "Cambisol", "Chernozem", "Cryosol", "Fluvisol", "Kastanozem", "Gleysol",
    "Gypsisol", "Histosol", "Leptosol", "Luvisol", "Phaeozem", "Planosol",
    "Podzol", "Regosol", "Solonchak", "Solonetz", "Umbrisol", "Vertisol"
  )
)

ggplot2::ggplot(soil) +
  ggplot2::geom_rect(ggplot2::aes(xmin = rep(0, 24), xmax = rep(1, 24),
                                  ymin = 1:24, ymax = 1:24+1, fill = name)) +
  ggplot2::scale_y_reverse() +
  scale_fill_soil(name = "Soil")