Paul Tol's iridescent Sequential Color Scheme
Usage
scale_colour_iridescent(
  ...,
  reverse = FALSE,
  range = c(0, 1),
  discrete = FALSE,
  aesthetics = "colour"
)

scale_color_iridescent(
  ...,
  reverse = FALSE,
  range = c(0, 1),
  discrete = FALSE,
  aesthetics = "colour"
)

scale_fill_iridescent(
  ...,
  reverse = FALSE,
  range = c(0, 1),
  discrete = FALSE,
  aesthetics = "fill"
)

scale_edge_colour_iridescent(
  ...,
  reverse = FALSE,
  range = c(0, 1),
  discrete = FALSE,
  aesthetics = "edge_colour"
)

scale_edge_color_iridescent(
  ...,
  reverse = FALSE,
  range = c(0, 1),
  discrete = FALSE,
  aesthetics = "edge_colour"
)

scale_edge_fill_iridescent(
  ...,
  reverse = FALSE,
  range = c(0, 1),
  discrete = FALSE,
  aesthetics = "edge_fill"
)
Arguments
- ...
Arguments passed to
ggplot2::continuous_scale().- reverse
A
logicalscalar. Should the resulting vector of colors be reversed?- range
A length-two
numericvector specifying the fraction of the scheme's color domain to keep. Only used ifdiscreteisFALSE.- discrete
A
logicalscalar: should the color scheme be used as a discrete scale? IfTRUE, it is a departure from Paul Tol's recommendations and likely a very poor use of color.- aesthetics
A
characterstring or vector of character strings listing the name(s) of the aesthetic(s) that this scale works with.
Value
A continuous scale.
Sequential Color Schemes
If more colors than defined are needed from a given scheme, the color coordinates are linearly interpolated to provide a continuous version of the scheme.
| Palette | Max. | NA value |
YlOrBr | 9 | #888888 |
iridescent | 23 | #999999 |
discreterainbow | 23 | #777777 |
smoothrainbow | 34 | #666666 |
References
Tol, P. (2018). Colour Schemes. SRON. Technical Note No. SRON/EPS/TN/09-002, issue 3.1. URL: https://sronpersonalpages.nl/~pault/data/colourschemes.pdf
See also
Other sequential color schemes:
scale_crameri_acton,
scale_crameri_bamako,
scale_crameri_batlow,
scale_crameri_batlowK,
scale_crameri_batlowW,
scale_crameri_bilbao,
scale_crameri_buda,
scale_crameri_davos,
scale_crameri_devon,
scale_crameri_glasgow,
scale_crameri_grayC,
scale_crameri_hawaii,
scale_crameri_imola,
scale_crameri_lajolla,
scale_crameri_lapaz,
scale_crameri_lipari,
scale_crameri_navia,
scale_crameri_naviaW,
scale_crameri_nuuk,
scale_crameri_oslo,
scale_crameri_tokyo,
scale_crameri_turku,
scale_tol_YlOrBr,
scale_tol_incandescent,
scale_tol_smoothrainbow
Other Paul Tol's color schemes:
scale_tol_BuRd,
scale_tol_PRGn,
scale_tol_YlOrBr,
scale_tol_bright,
scale_tol_dark,
scale_tol_discreterainbow,
scale_tol_highcontrast,
scale_tol_incandescent,
scale_tol_light,
scale_tol_mediumcontrast,
scale_tol_muted,
scale_tol_nightfall,
scale_tol_pale,
scale_tol_smoothrainbow,
scale_tol_sunset,
scale_tol_vibrant
Examples
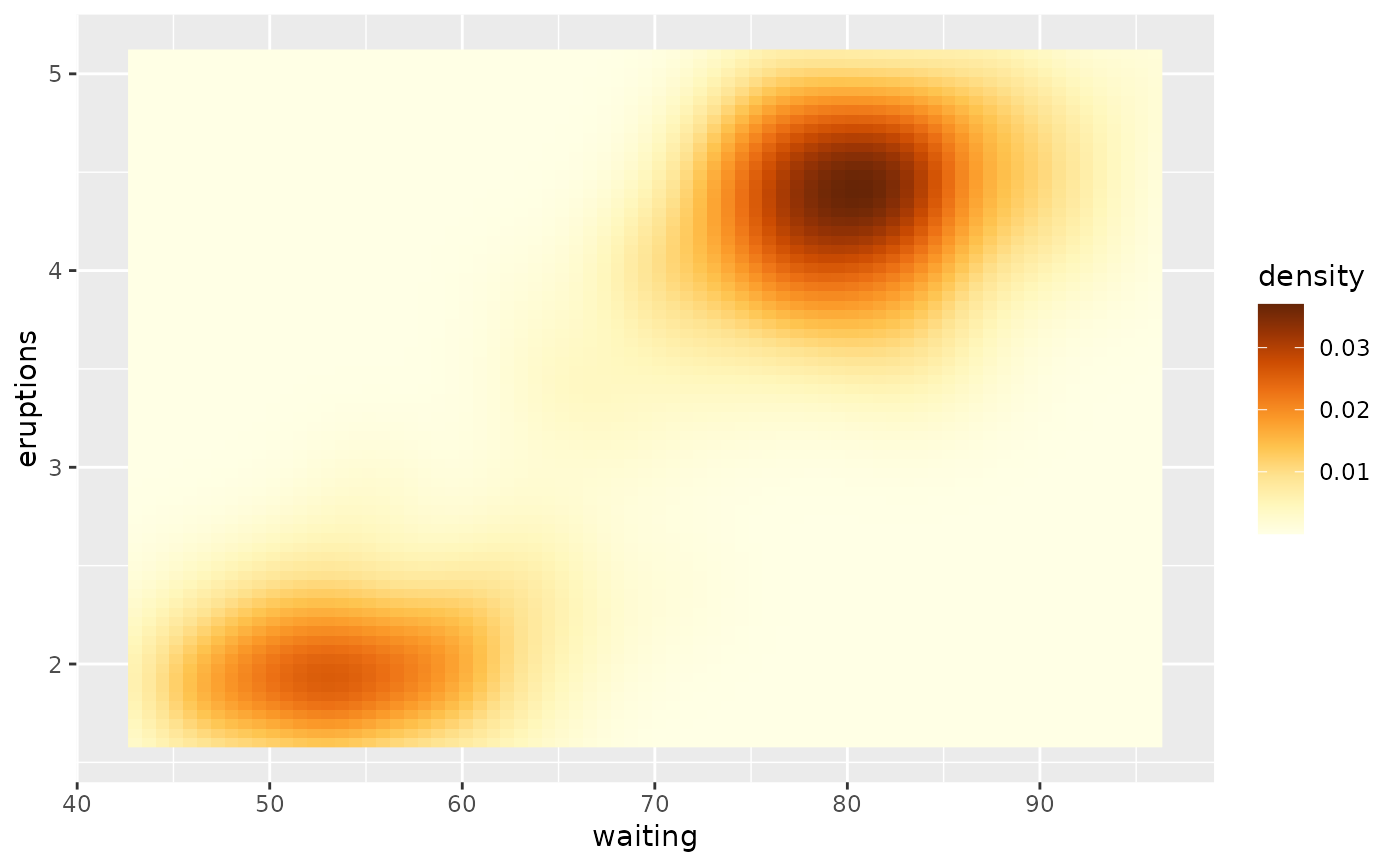
data(faithfuld, package = "ggplot2")
ggplot2::ggplot(faithfuld, ggplot2::aes(waiting, eruptions, fill = density)) +
ggplot2::geom_raster() +
scale_fill_YlOrBr()
 ggplot2::ggplot(faithfuld, ggplot2::aes(waiting, eruptions, fill = density)) +
ggplot2::geom_raster() +
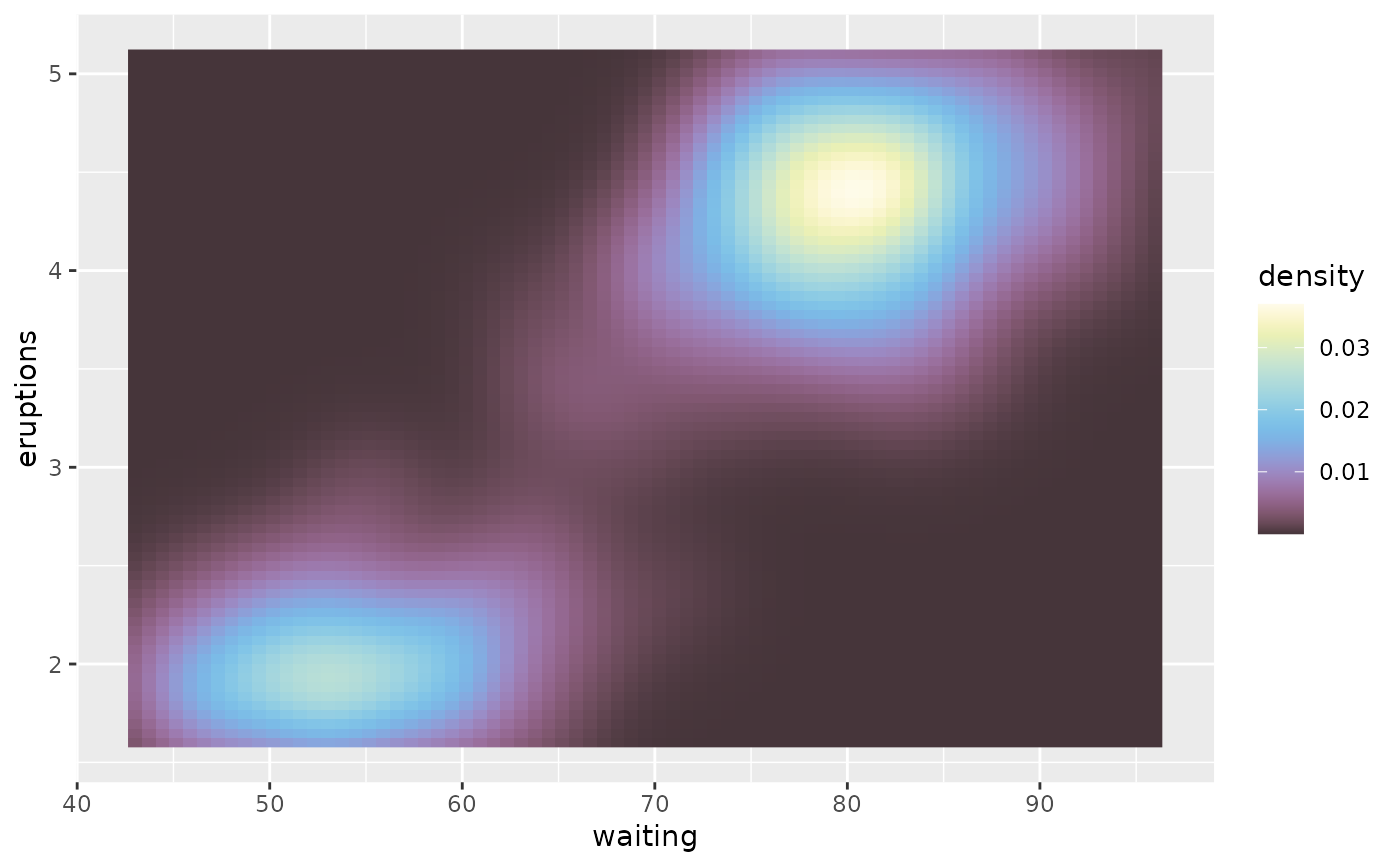
scale_fill_iridescent(reverse = TRUE)
ggplot2::ggplot(faithfuld, ggplot2::aes(waiting, eruptions, fill = density)) +
ggplot2::geom_raster() +
scale_fill_iridescent(reverse = TRUE)
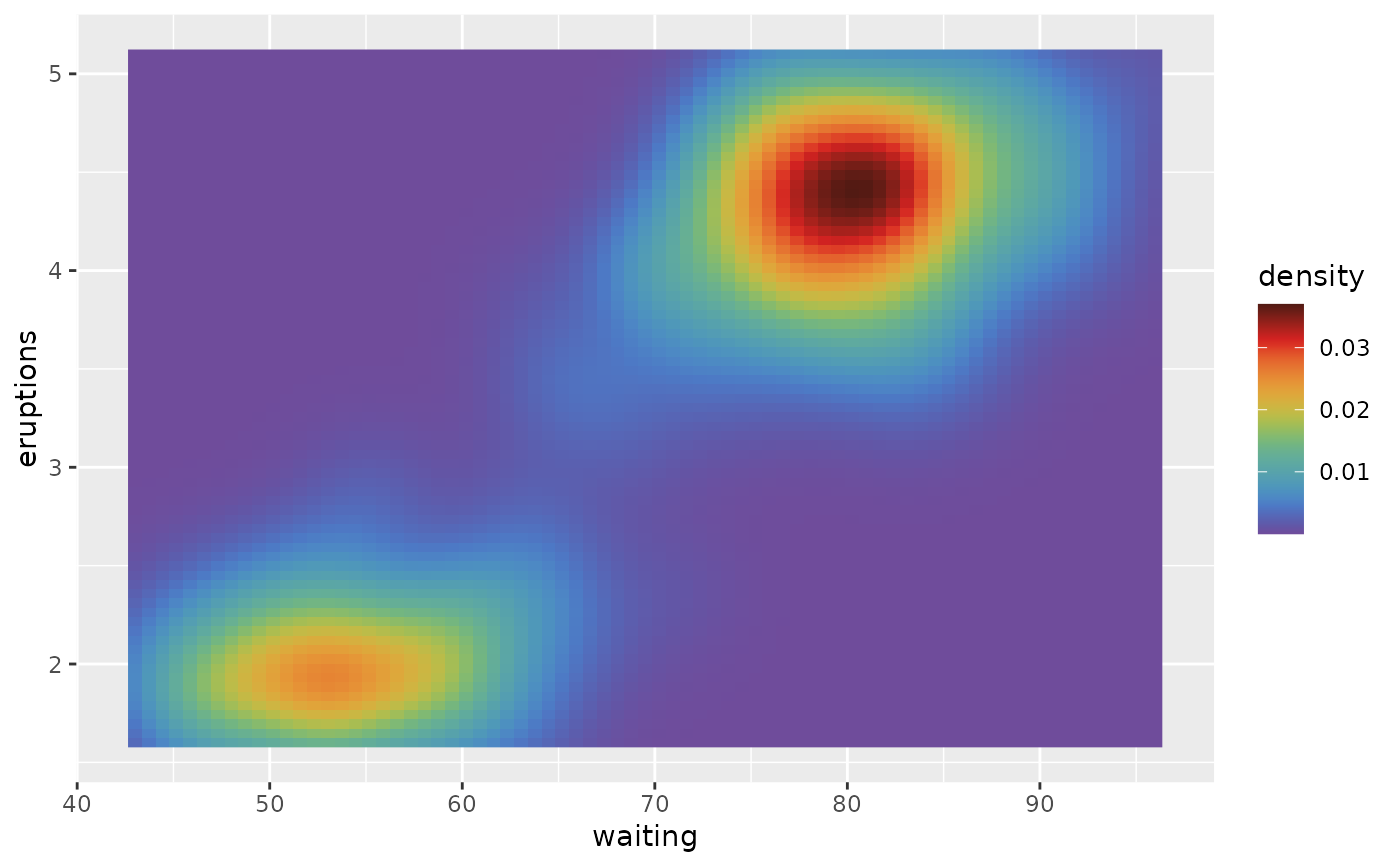
 ggplot2::ggplot(faithfuld, ggplot2::aes(waiting, eruptions, fill = density)) +
ggplot2::geom_raster() +
scale_fill_smoothrainbow(range = c(0.25, 1))
ggplot2::ggplot(faithfuld, ggplot2::aes(waiting, eruptions, fill = density)) +
ggplot2::geom_raster() +
scale_fill_smoothrainbow(range = c(0.25, 1))