Outlier Detection
Usage
outliers(object, ...)

# S4 method for CompositionMatrix
outliers(
  object,
  ...,
  groups = get_groups(object),
  robust = TRUE,
  method = c("mve", "mcd"),
  quantile = 0.975
)
Arguments
- object
- ...
Extra parameters to be passed to
MASS::cov.rob(). Only used ifrobustisTRUE.- groups
A
factorin the sense thatas.factor(groups)defines the grouping. If set, XXX.- robust
A
logicalscalar: should robust location and scatter estimation be used?- method
A
characterstring specifying the method to be used. It must be one of "mve" (minimum volume ellipsoid) or "mcd" (minimum covariance determinant). Only used ifrobustisTRUE.- quantile
A length-one
numericvector giving the significance level.quantileis used as a cut-off value for outlier detection: observations with larger (squared) Mahalanobis distance are considered as potential outliers.
Value
An OutlierIndex object.
Details
An outlier can be defined as having a very large Mahalanobis distance from all observations. In this way, a certain proportion of the observations can be identified, e.g. the top 2% of values (i.e. values above the 0.98th percentile of the Chi-2 distribution).
On the one hand, the Mahalanobis distance is likely to be strongly affected by the presence of outliers. Rousseeuw and van Zomeren (1990) thus recommend using robust methods (which are not excessively affected by the presence of outliers).
On the other hand, the choice of the threshold for classifying an observation as an outlier should be discussed. There is no apparent reason why a particular threshold should be applicable to all data sets (Filzmoser, Garrett, and Reimann 2005).
References
Filzmoser, P., Garrett, R. G. & Reimann, C. (2005). Multivariate outlier detection in exploration geochemistry. Computers & Geosciences, 31(5), 579-587. doi:10.1016/j.cageo.2004.11.013 .
Filzmoser, P. & Hron, K. (2008). Outlier Detection for Compositional Data Using Robust Methods. Mathematical Geosciences, 40(3), 233-248. doi:10.1007/s11004-007-9141-5 .
Filzmoser, P., Hron, K. & Reimann, C. (2012). Interpretation of multivariate outliers for compositional data. Computers & Geosciences, 39, 77-85. doi:10.1016/j.cageo.2011.06.014 .
Rousseeuw, P. J. & van Zomeren, B. C. (1990). Unmasking Multivariate Outliers and Leverage Points. Journal of the American Statistical Association, 85(411): 633-639. doi:10.1080/01621459.1990.10474920 .
Santos, F. (2020). Modern methods for old data: An overview of some robust methods for outliers detection with applications in osteology. Journal of Archaeological Science: Reports, 32, 102423. doi:10.1016/j.jasrep.2020.102423 .
See also
Other outlier detection methods:
plot_outliers
Examples
## Data from Day et al. 2011
data("kommos", package = "folio") # Coerce to compositional data
kommos <- remove_NA(kommos, margin = 1) # Remove cases with missing values
coda <- as_composition(kommos, groups = 1) # Use ceramic types for grouping
## Detect outliers
out <- outliers(coda, groups = NULL, robust = FALSE)
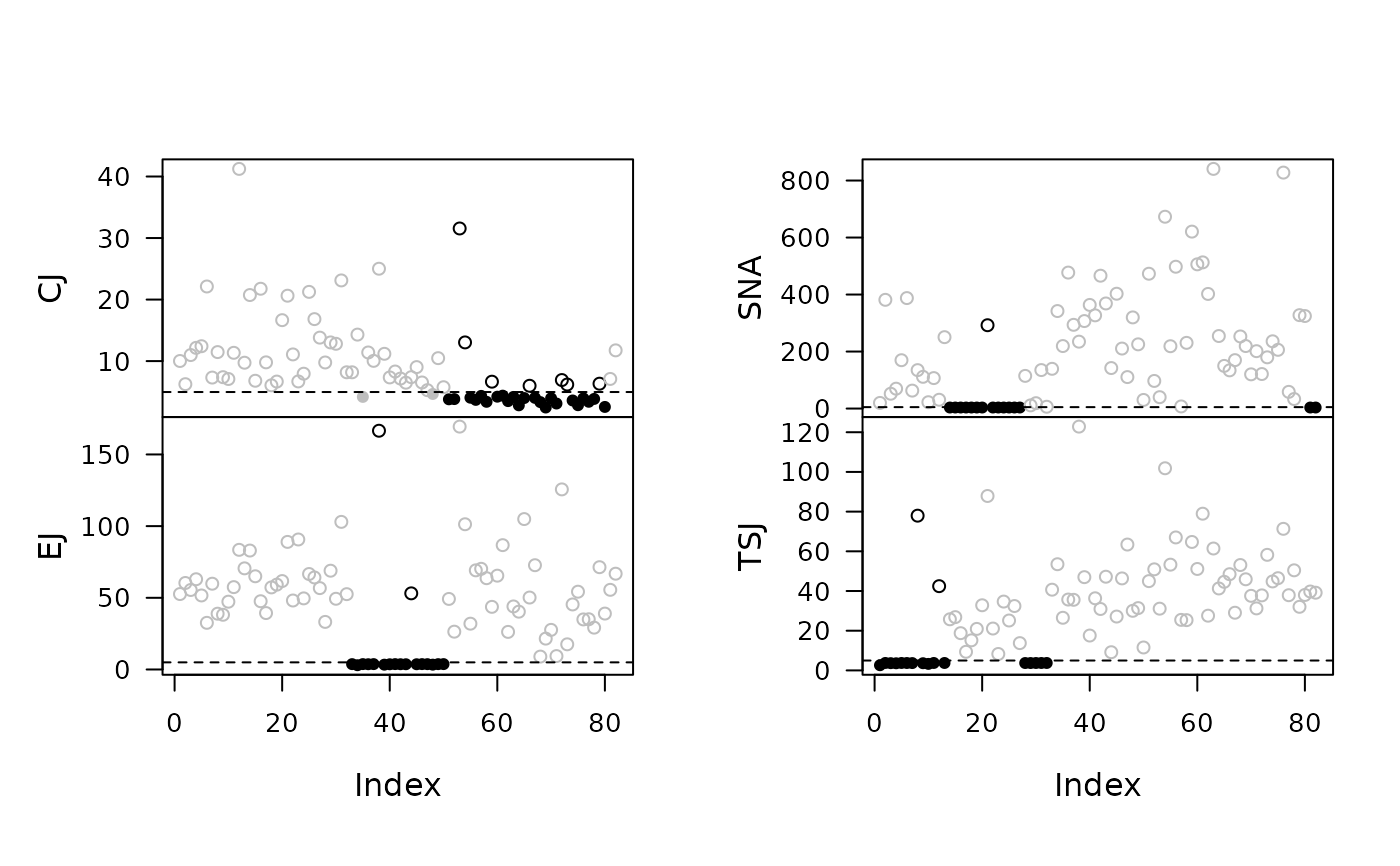
plot(out) # Plot
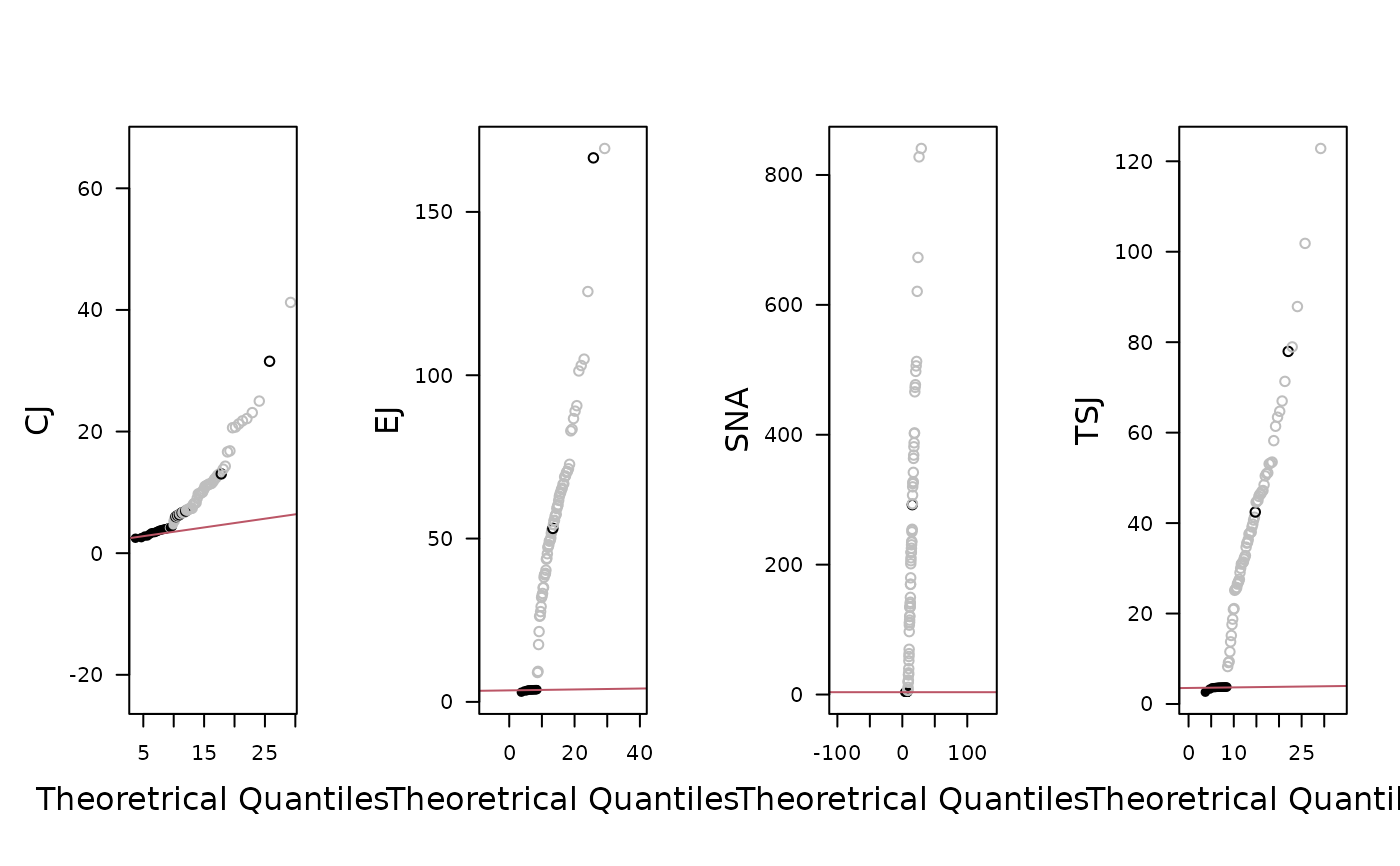
 plot(out, qq = TRUE) # Quantile-Quantile plot
 ## Detect outliers by group
out <- outliers(coda[, 1:15, drop = FALSE])
plot(out, ncol = 2) # Plot
## Detect outliers by group
out <- outliers(coda[, 1:15, drop = FALSE])
plot(out, ncol = 2) # Plot
 plot(out, qq = TRUE, ncol = 4) # Quantile-Quantile plot