Displays a scatter plot.
Usage
# S4 method for class 'LogRatio,missing'
plot(
  x,
  ...,
  jitter_factor = 1,
  jitter_amount = NULL,
  xlab = NULL,
  ylab = NULL,
  main = NULL,
  sub = NULL,
  ann = graphics::par("ann"),
  axes = TRUE,
  frame.plot = axes
)

# S4 method for class 'GroupedLogRatio,missing'
plot(
  x,
  ...,
  jitter_factor = 1,
  jitter_amount = NULL,
  color = NULL,
  symbol = NULL,
  xlab = NULL,
  ylab = NULL,
  main = NULL,
  sub = NULL,
  ann = graphics::par("ann"),
  axes = TRUE,
  frame.plot = axes,
  legend = list(x = "topright")
)
Arguments
- x
A
LogRatioobject.- ...
Further graphical parameters.
- jitter_factor, jitter_amount
A length-one
numericvector specifying the amount of jitter (seejitter()).- xlab, ylab
A
charactervector giving the x and y axis labels.- main
A
characterstring giving a main title for the plot.- sub
A
characterstring giving a subtitle for the plot.- ann
A
logicalscalar: should the default annotation (title and x and y axis labels) appear on the plot?- axes
A
logicalscalar: should axes be drawn on the plot?- frame.plot
A
logicalscalar: should a box be drawn around the plot?- color
A (named) vector of colors (will be mapped to the group names of
object) or afunctionthat when called with a single argument (an integer specifying the number of colors) returns a vector of colors.- symbol
A (named) vector of colors (will be mapped to the group names of
object).- legend
A
listof additional arguments to be passed tographics::legend(); names of the list are used as argument names. IfNULL, no legend is displayed.
Value
plot() is called for its side-effects: is results in a graphic being
displayed (invisibly return x).
Examples
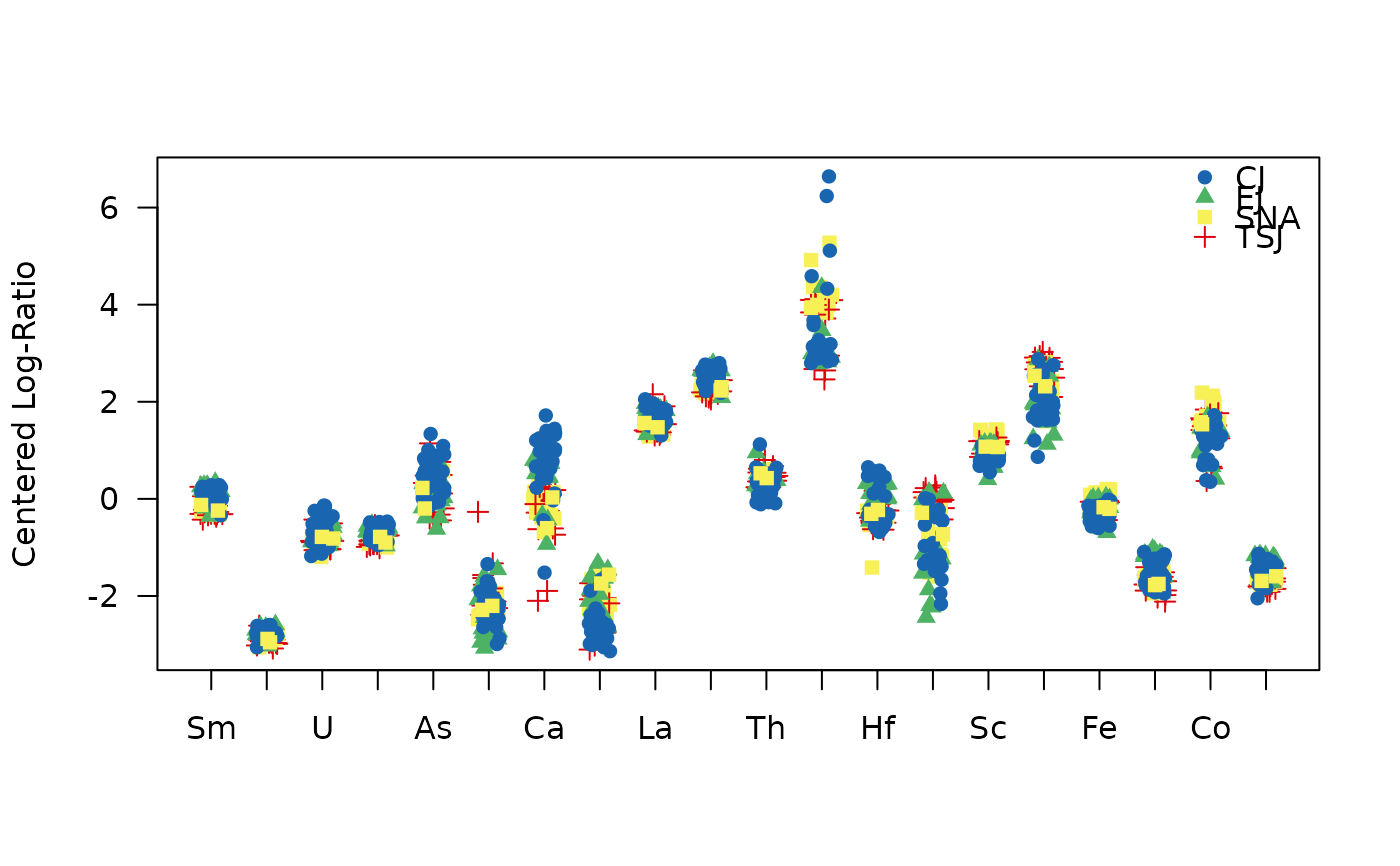
## Data from Day et al. 2011
data("kommos", package = "folio")
kommos <- remove_NA(kommos, margin = 1) # Remove cases with missing values
coda <- as_composition(kommos, parts = 3:22) # Coerce to compositional data

## Log ratio
clr <- transform_clr(coda)

## Boxplot
plot(clr)


## Use ceramic types for grouping
grp <- group(coda, by = kommos$type)
clr <- transform_clr(grp)
plot(clr)
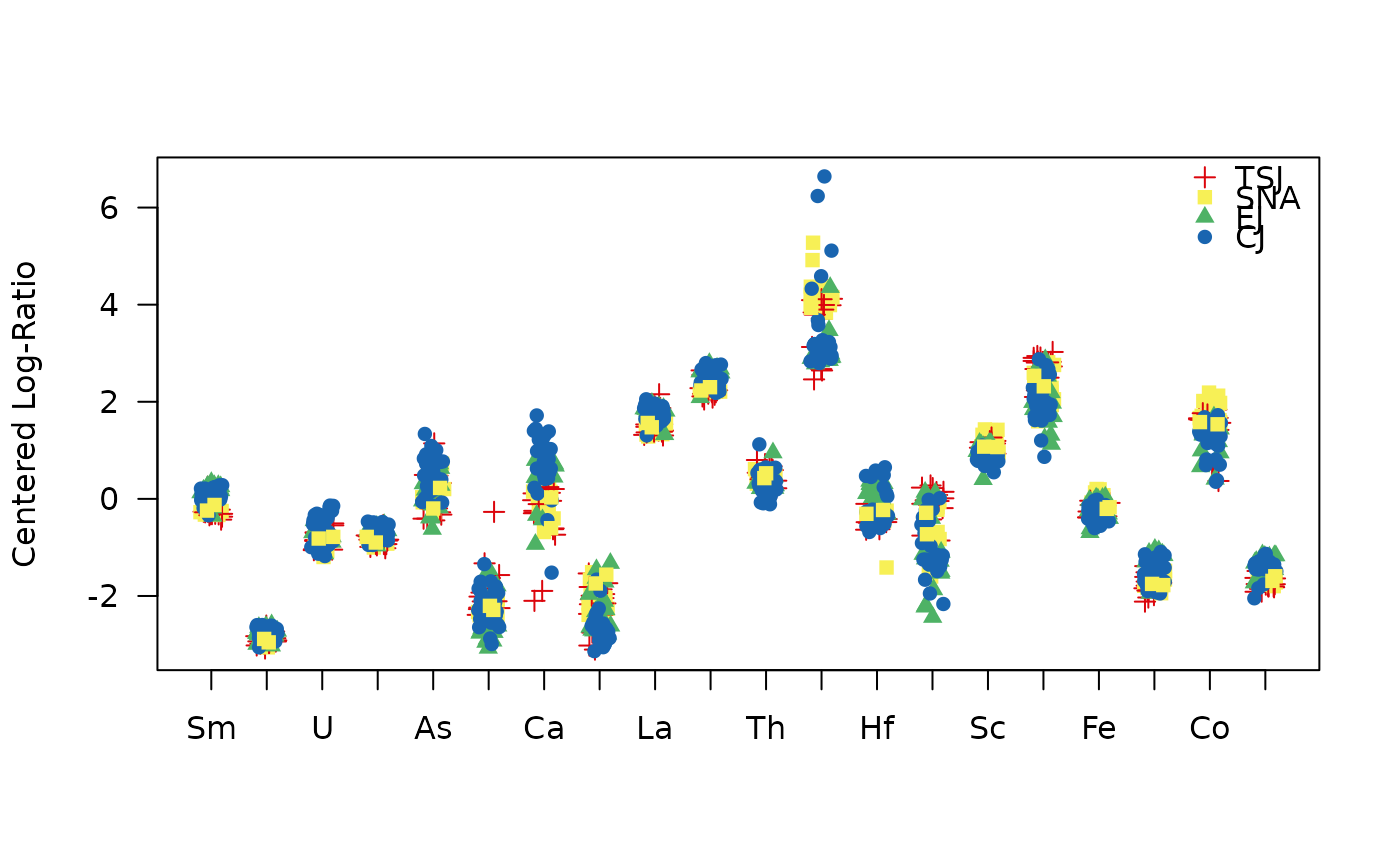
## Use ceramic types for grouping
grp <- group(coda, by = kommos$type)
clr <- transform_clr(grp)
plot(clr)