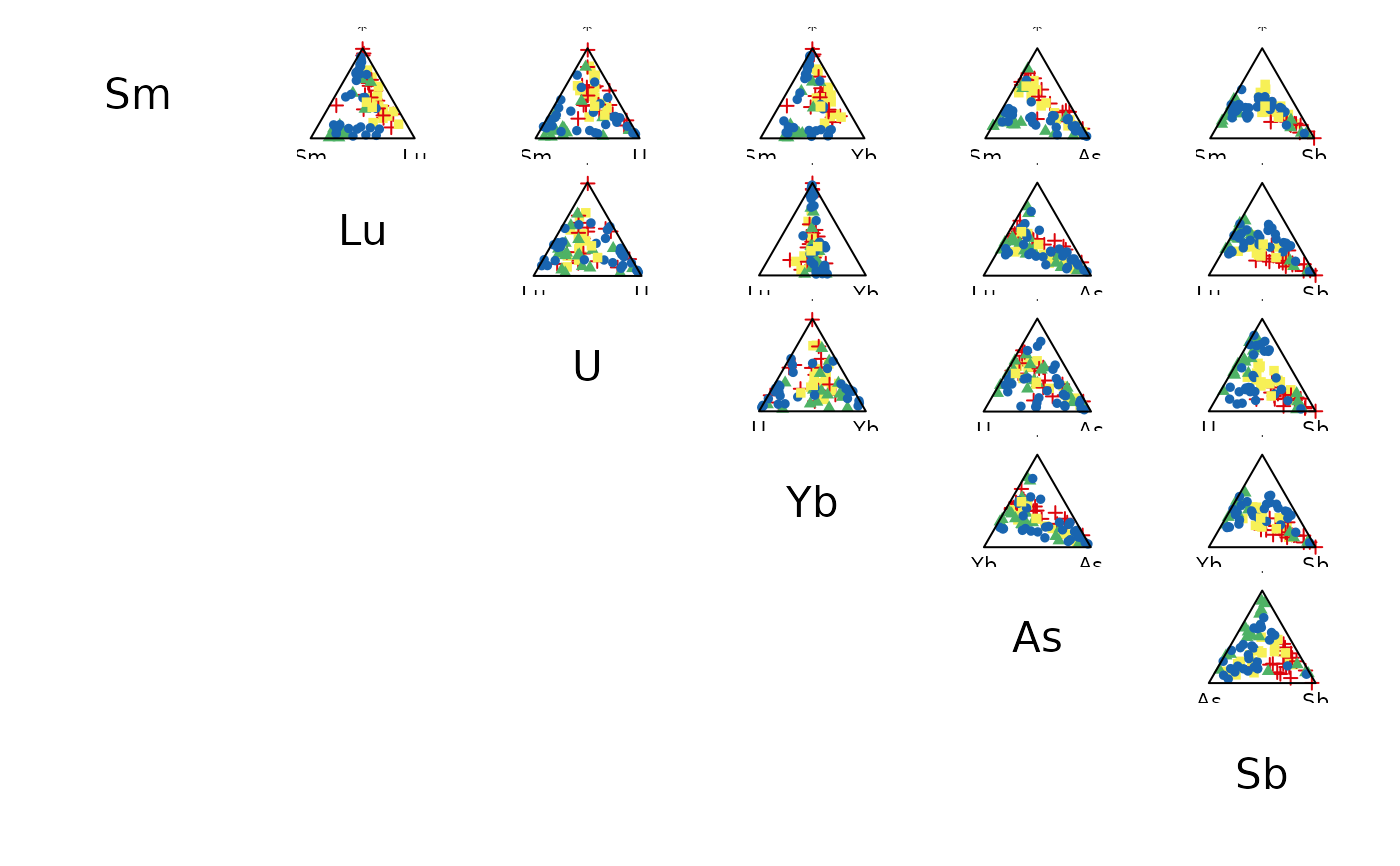
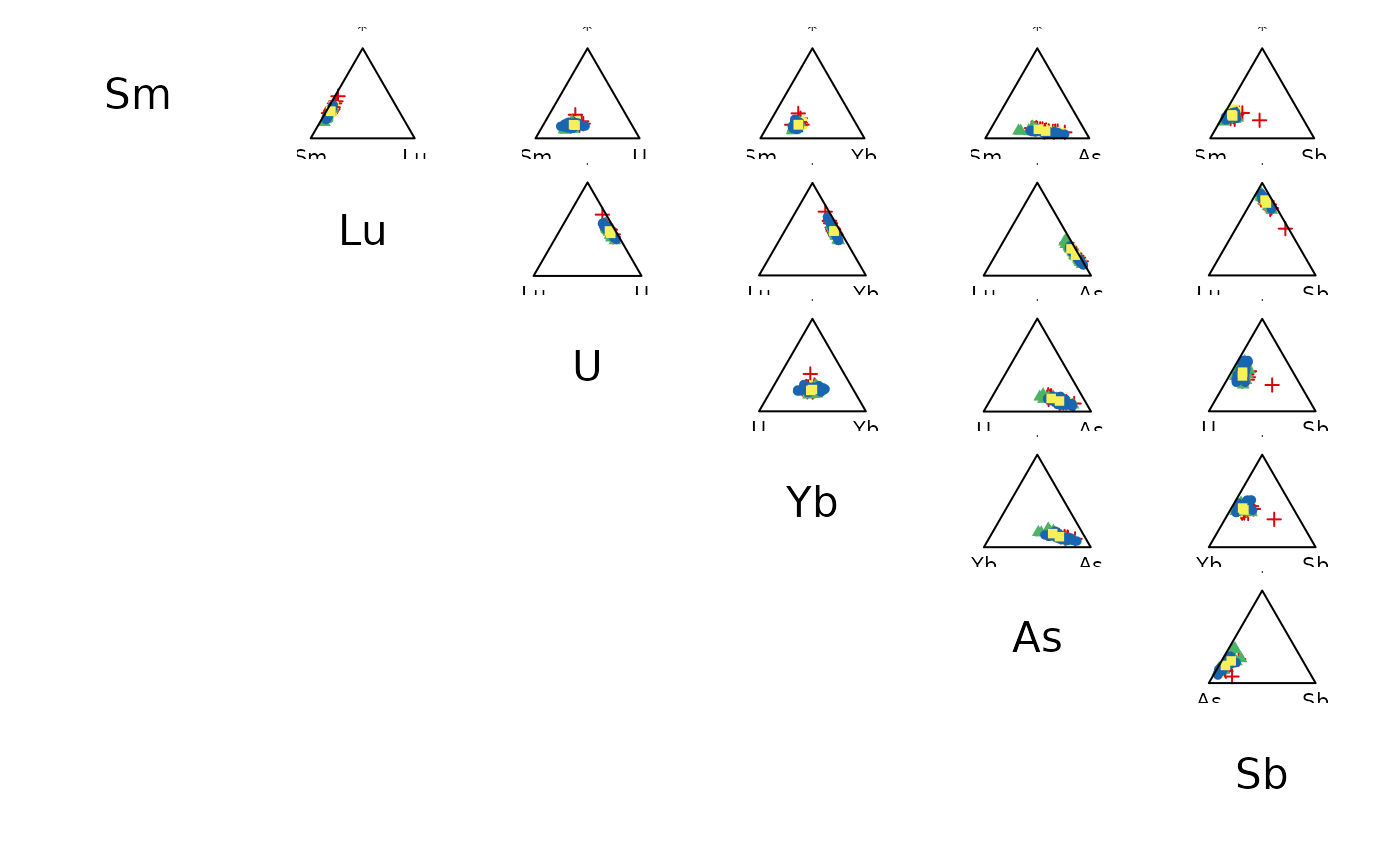
Displays a matrix of ternary plots.
Usage
# S4 method for class 'CompositionMatrix'
pairs(x, margin = NULL, ...)

# S4 method for class 'GroupedComposition'
pairs(x, ..., margin = NULL, color = NULL, symbol = NULL)
Arguments
- x
A
CompositionMatrixobject.- margin
A
characterstring or anintegergiving the index of the column to be used as the third part of the ternary plots. IfNULL(the default), marginal compositions will be used (i.e. the geometric mean of the non-selected parts).- ...
Further graphical parameters.
- color
A (named) vector of colors (will be mapped to the group names of
object) or afunctionthat when called with a single argument (an integer specifying the number of colors) returns a vector of colors.- symbol
A (named) vector of colors (will be mapped to the group names of
object).
Value
plot() is called for its side-effects: is results in a graphic being
displayed (invisibly return x).
See also
isopleuros::ternary_pairs(), isopleuros::ternary_plot()
Other plot methods:
as_graph(),
barplot(),
boxplot(),
hist(),
plot()
Examples
## Data from Day et al. 2011
data("kommos", package = "folio") # Coerce to compositional data
kommos <- remove_NA(kommos, margin = 1) # Remove cases with missing values
coda <- as_composition(kommos, parts = 3:8, groups = 1)

## Use ceramic types for grouping
pairs(coda)


## Center and scale ternary plots
pairs(coda, by = NULL, center = TRUE, scale = TRUE)
## Center and scale ternary plots
pairs(coda, by = NULL, center = TRUE, scale = TRUE)