Produces a ternary plot.
Usage
ternary_plot(x, y, z, ...)

# S4 method for class 'numeric,numeric,numeric'
ternary_plot(
  x,
  y,
  z,
  center = FALSE,
  scale = FALSE,
  xlim = NULL,
  ylim = NULL,
  zlim = NULL,
  xlab = NULL,
  ylab = NULL,
  zlab = NULL,
  main = NULL,
  sub = NULL,
  ann = graphics::par("ann"),
  axes = TRUE,
  frame.plot = axes,
  panel.first = NULL,
  panel.last = NULL,
  ...
)

# S4 method for class 'ANY,missing,missing'
ternary_plot(
  x,
  xlim = NULL,
  ylim = NULL,
  zlim = NULL,
  xlab = NULL,
  ylab = NULL,
  zlab = NULL,
  main = NULL,
  sub = NULL,
  ann = graphics::par("ann"),
  axes = TRUE,
  frame.plot = axes,
  panel.first = NULL,
  panel.last = NULL,
  ...
)
Arguments
- x, y, z
A
numericvector giving the x, y and z ternary coordinates of a set of points. Ifyandzare missing, an attempt is made to interpretxin a suitable way (seegrDevices::xyz.coords()).- ...
Other graphical parameters may also be passed as arguments to this function.
- center
A
logicalscalar: should the data be centered?- scale
A
logicalscalar: should the data be scaled?- xlim
A length-three
numericvector giving thexlimits in the range \([0,1]\).- ylim
A length-three
numericvector giving theylimits in the range \([0,1]\).- zlim
A length-three
numericvector giving thezlimits in the range \([0,1]\).- xlab, ylab, zlab
A
characterstring giving a label for the x, y and z axes.- main
A
characterstring giving a main title for the plot.- sub
A
characterstring giving a subtitle for the plot.- ann
A
logicalscalar: should the default annotation (title and x, y and z axis labels) appear on the plot?- axes
A
logicalscalar: should axes be drawn on the plot?- frame.plot
A
logicalscalar: should a box be drawn around the plot?- panel.first
An an
expressionto be evaluated after the plot axes are set up but before any plotting takes place. This can be useful for drawing background grids.- panel.last
An
expressionto be evaluated after plotting has taken place but before the axes, title and box are added.
Value
ternary_plot() is called it for its side-effects: it results in a graphic
being displayed. Invisibly returns a list with the components:
x | A numeric vector of x values. |
y | A numeric vector of y values. |
z | A numeric vector of z values. |
center | A numeric vector giving the center. |
scale | A numeric vector giving the scale factor. |
See also
Other graphical elements:
ternary_axis(),
ternary_box(),
ternary_grid(),
ternary_pairs(),
ternary_title()
Examples
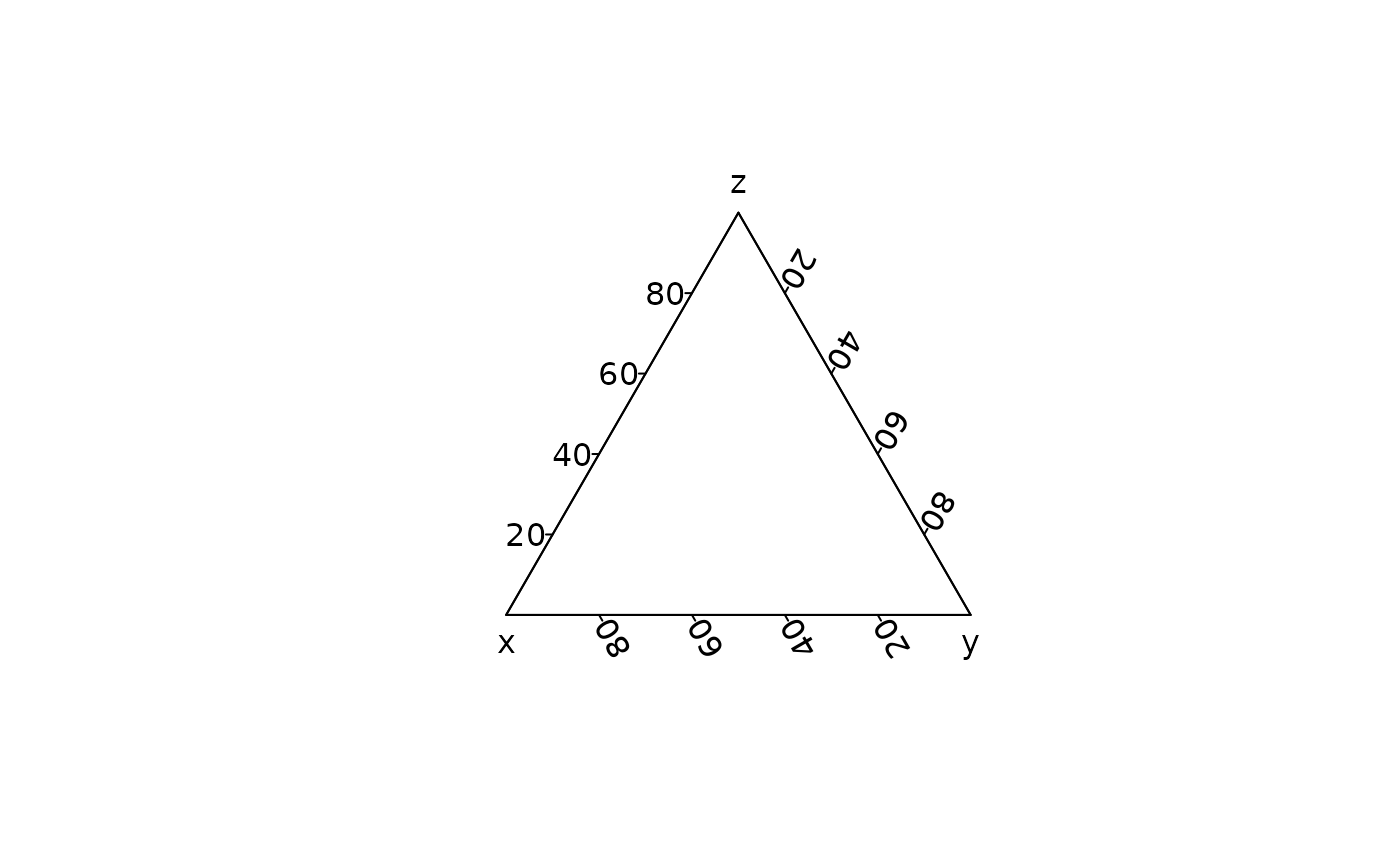
## Blank plot
ternary_plot(NULL)
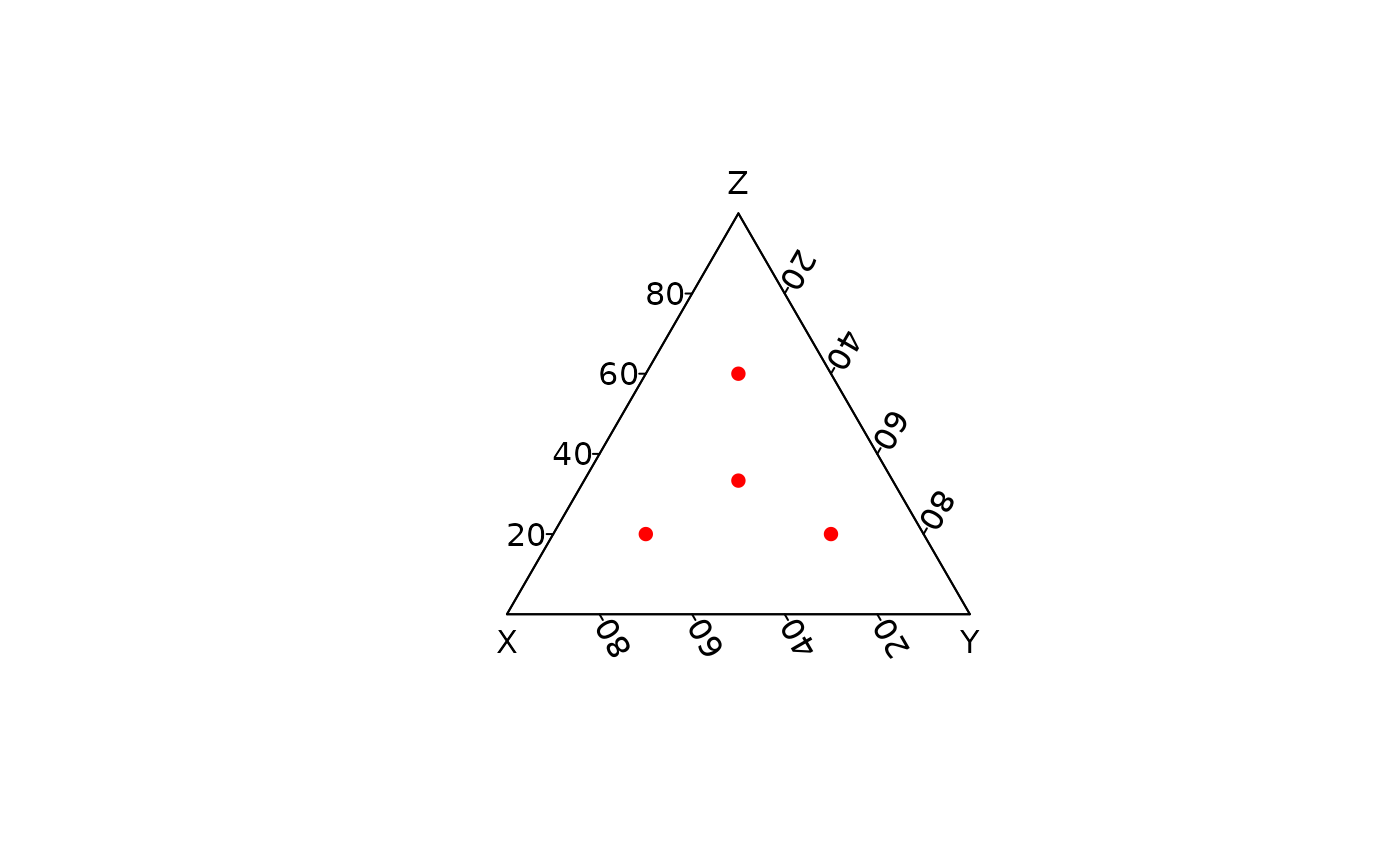
 ## Compositional data
coda <- data.frame(
X = c(20, 60, 20, 1/3),
Y = c(20, 20, 60, 1/3),
Z = c(60, 20, 20, 1/3)
)
## Ternary plot
ternary_plot(coda, pch = 16, col = "red")
## Compositional data
coda <- data.frame(
X = c(20, 60, 20, 1/3),
Y = c(20, 20, 60, 1/3),
Z = c(60, 20, 20, 1/3)
)
## Ternary plot
ternary_plot(coda, pch = 16, col = "red")
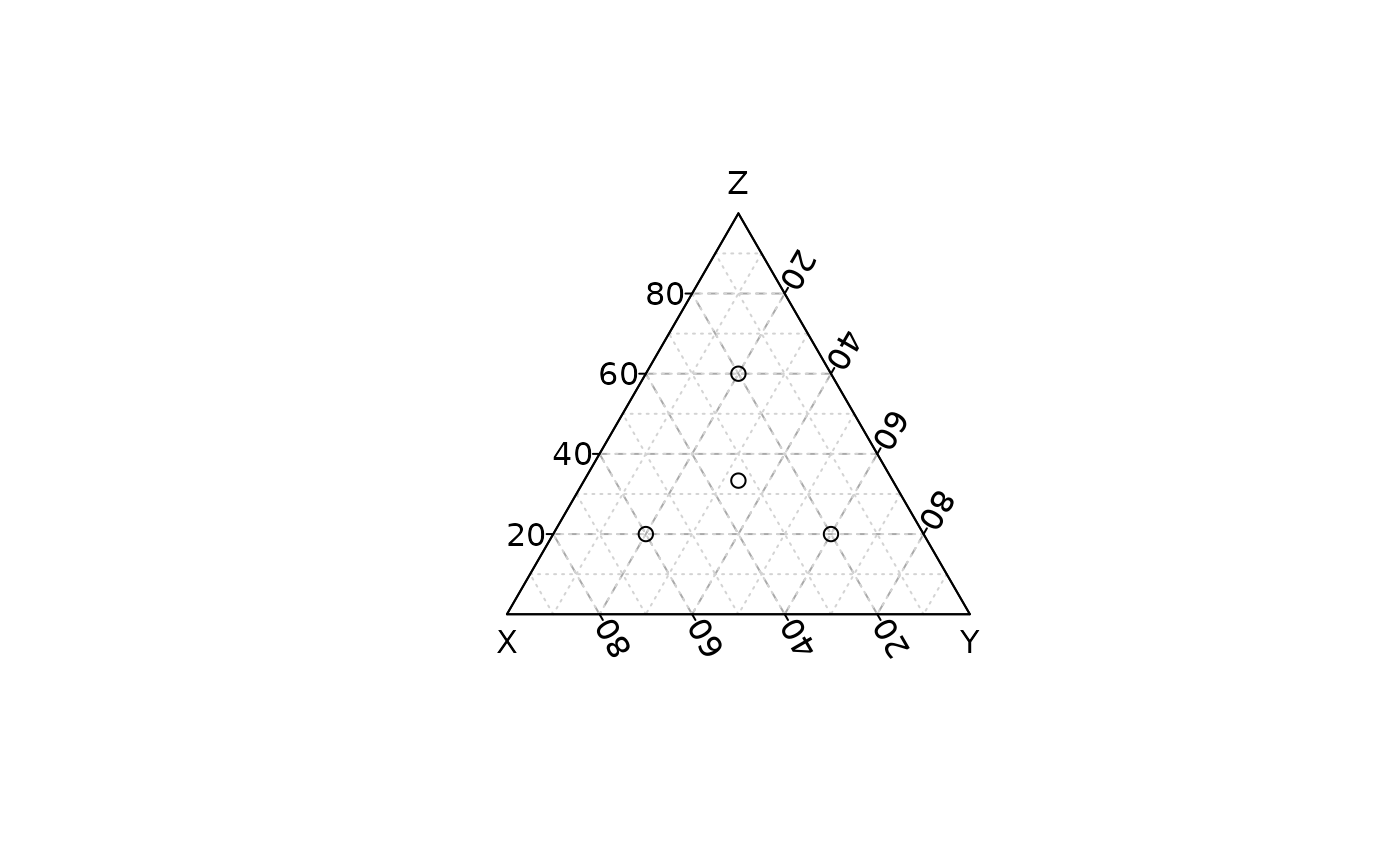
 ## Add a grid
ternary_plot(coda, panel.first = ternary_grid(5, 10))
## Add a grid
ternary_plot(coda, panel.first = ternary_grid(5, 10))
 ## Zoom
ternary_plot(coda, ylim = c(0, 0.4, 0), zlim = c(0, 0, 0.4),
panel.first = ternary_grid())
## Zoom
ternary_plot(coda, ylim = c(0, 0.4, 0), zlim = c(0, 0, 0.4),
panel.first = ternary_grid())
 ternary_plot(coda, xlim = c(0, 0.4, 0), zlim = c(0, 0, 0.4),
panel.first = ternary_grid())
ternary_plot(coda, xlim = c(0, 0.4, 0), zlim = c(0, 0, 0.4),
panel.first = ternary_grid())
 ternary_plot(coda, xlim = c(0.4, 0, 0), ylim = c(0, 0.4, 0),
panel.first = ternary_grid())
ternary_plot(coda, xlim = c(0.4, 0, 0), ylim = c(0, 0.4, 0),
panel.first = ternary_grid())
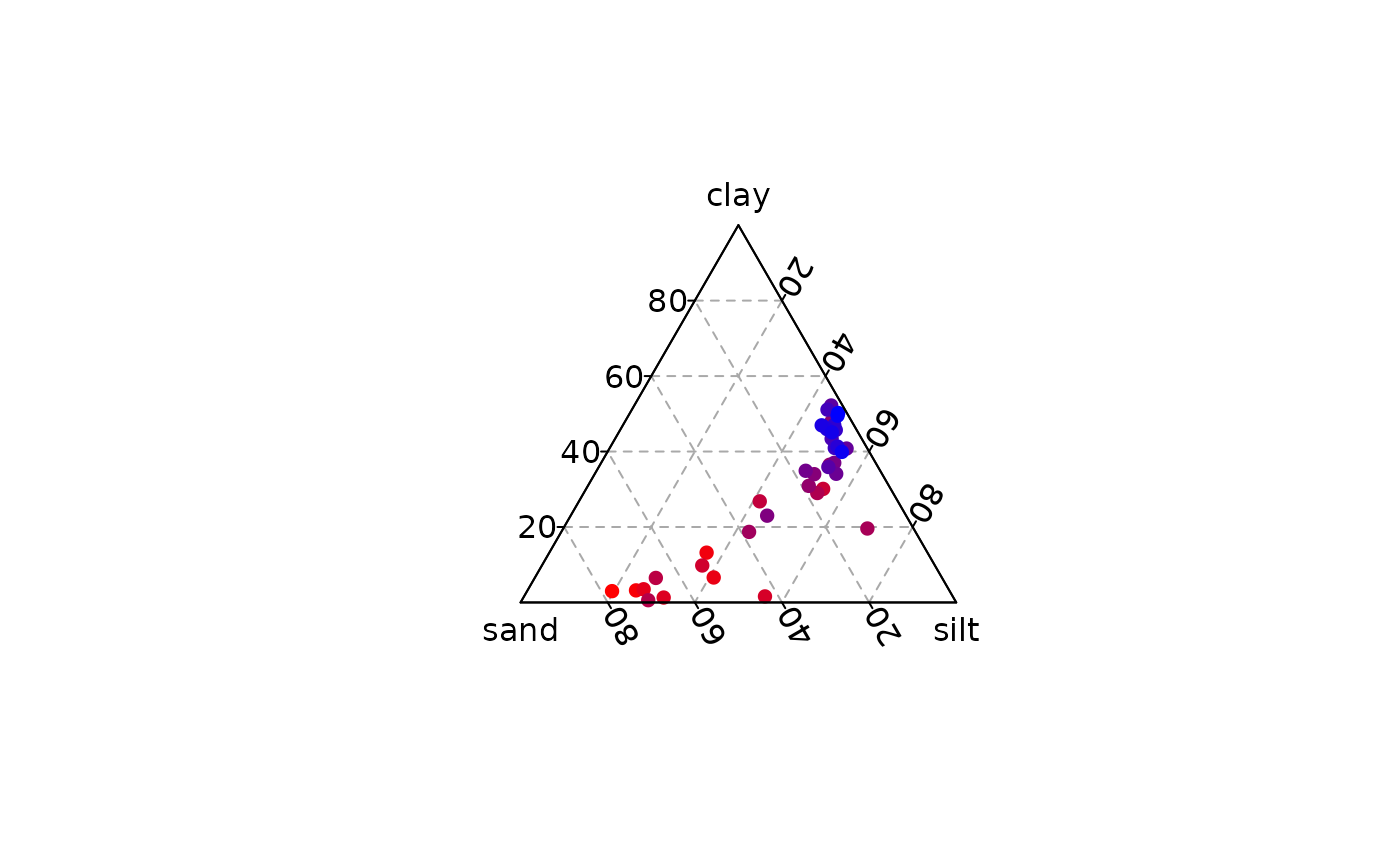
 ## Color according to a supplementary variable
## Data from Aitchison 1986
col <- grDevices::colorRampPalette(c("red", "blue"))(nrow(arctic))
ternary_plot(arctic, panel.first = ternary_grid(), pch = 16, col = col)
## Color according to a supplementary variable
## Data from Aitchison 1986
col <- grDevices::colorRampPalette(c("red", "blue"))(nrow(arctic))
ternary_plot(arctic, panel.first = ternary_grid(), pch = 16, col = col)