Adds an axis to the current plot.
Arguments
- side
An
integerspecifying which side of the plot the axis is to be drawn on. The axis is placed as follows: 1=below, 2=right and 3=left.- at
A
numericvector giving the points at which tick-marks are to be drawn.- labels
A
logicalscalar specifying whether (numerical) annotations are to be made at the tickmarks, or acharactervector of labels to be placed at the tickpoints. If this is notlogical,atshould also be supplied and of the same length.- tick
A
logicalscalar: should tickmarks and an axis line be drawn?- center
A
numericvector giving the center. IfNULL(the default), data are assumed not centered.- scale
A
numericvector giving the scale factor. IfNULL(the default), data are assumed not scaled.- font
font for text. Defaults to
par("font.axis").- lty
A
characterstring ornumericvalue specifying the line type for both the axis line and the tick marks.- lwd, lwd.ticks
A non-negative
numericvalue specifying the line widths for the axis line and the tick marks.- col, col.ticks
Colors for the axis line and the tick marks respectively. Defaults to
par("col.axis").- ...
Other graphical parameters may also be passed as arguments to this function, particularly,
cex.axis,col.axisandfont.axisfor axis annotation.
See also
Other graphical elements:
ternary_box(),
ternary_grid(),
ternary_pairs(),
ternary_plot(),
ternary_title()
Examples
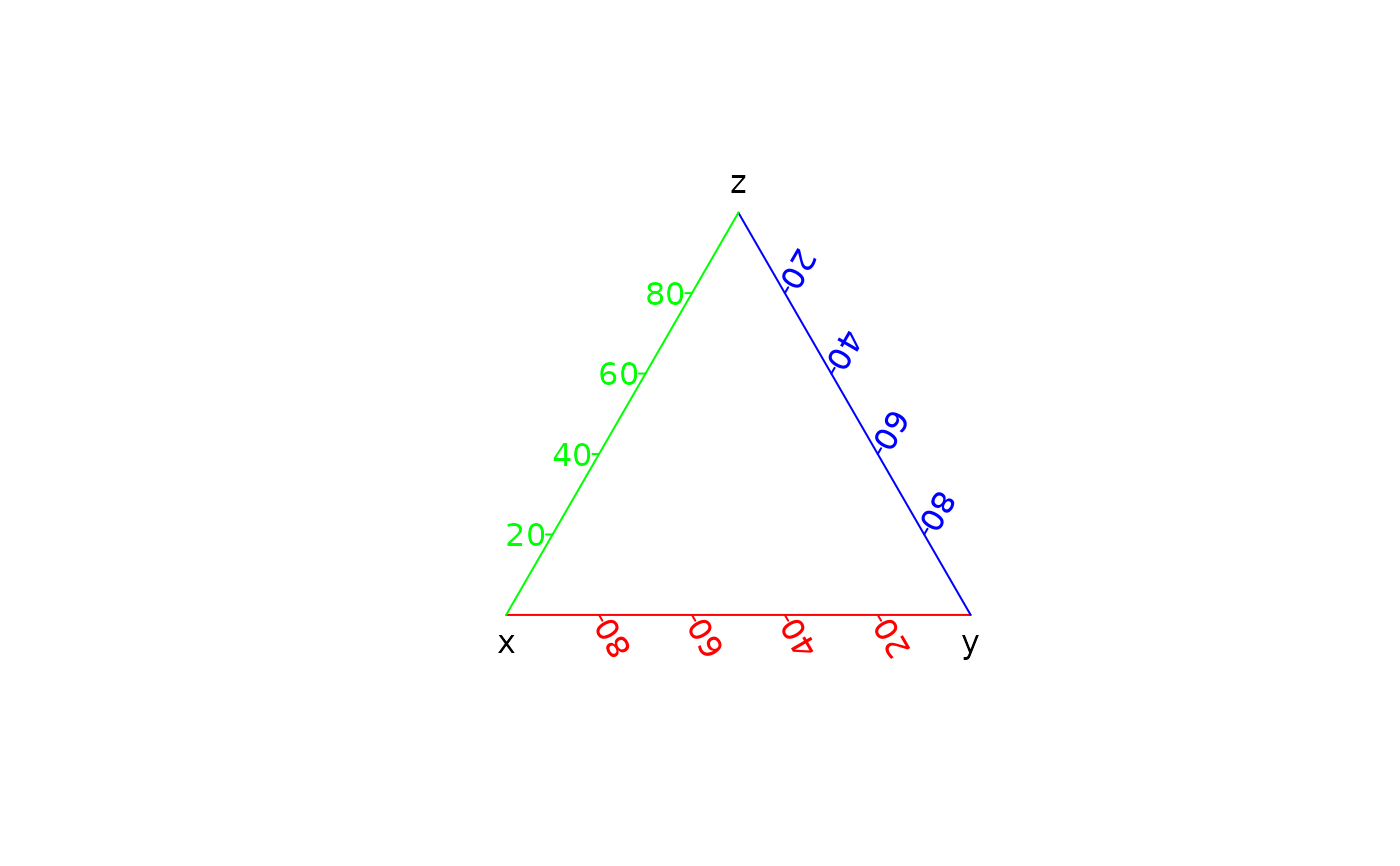
## Add axis
ternary_plot(NULL, axes = FALSE)
ternary_axis(side = 1, col = "red")
ternary_axis(side = 2, col = "blue")
ternary_axis(side = 3, col = "green")
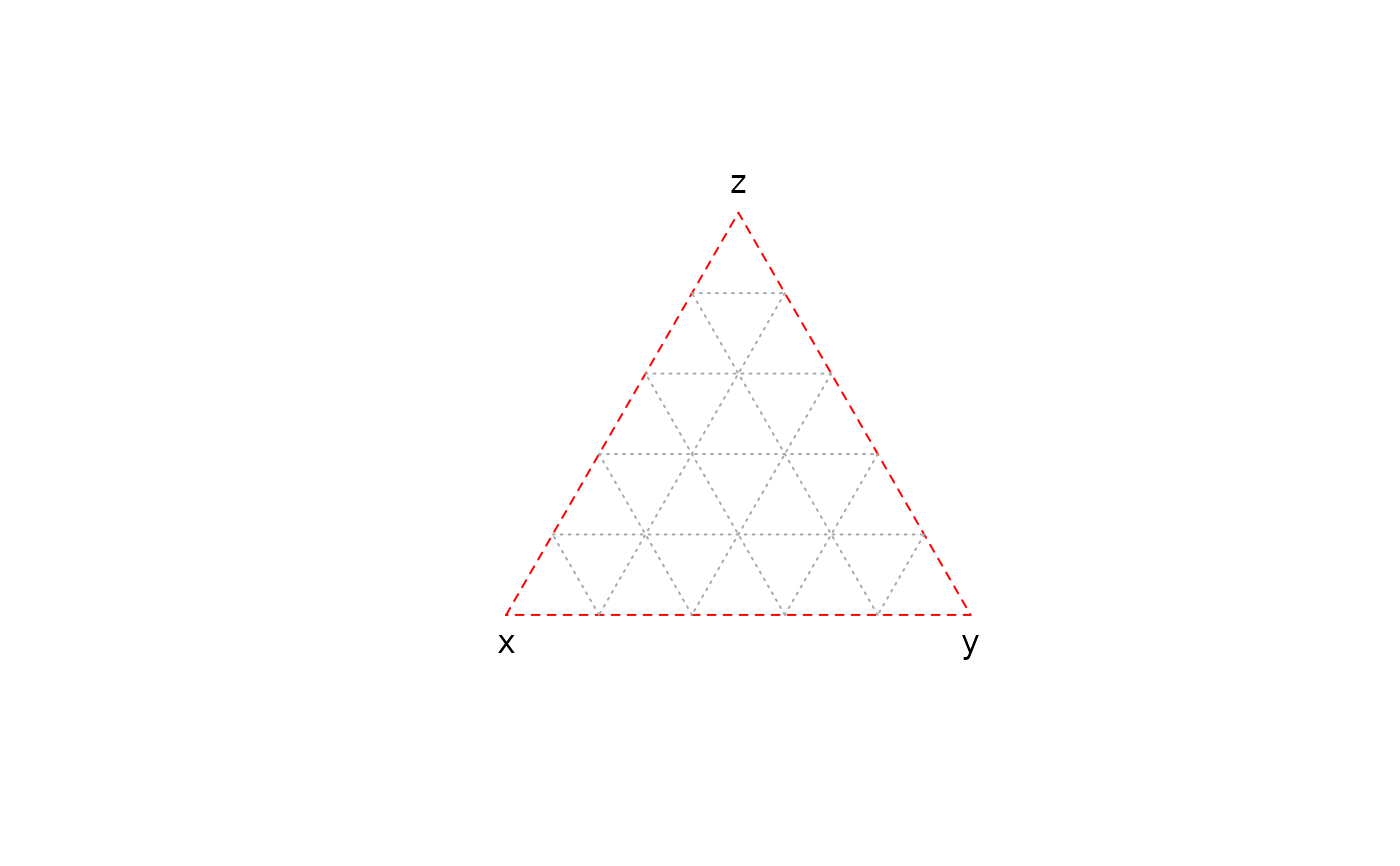
 ## Add box and grid
ternary_plot(NULL, axes = FALSE)
ternary_box(lty = "dashed", col = "red")
ternary_grid(lty.primary = "dotted")
## Add box and grid
ternary_plot(NULL, axes = FALSE)
ternary_box(lty = "dashed", col = "red")
ternary_grid(lty.primary = "dotted")