Adds a triangular grid to an existing plot.
Arguments
- primary
An
integerspecifying the number of cells of the primary grid inx,yandzdirection.- secondary
An
integerspecifying the number of cells of the secondary grid inx,yandzdirection.- center
A
numericvector giving the center. IfNULL(the default), data are assumed not centered.- scale
A
numericvector giving the scale factor. IfNULL(the default), data are assumed not scaled.- col.primary, col.secondary
A
characterstring specifying the color of the grid lines.- lty.primary, lty.secondary
A
characterstring ornumericvalue specifying the line type of the grid lines.- lwd.primary, lwd.secondary
A non-negative
numericvalue specifying the line width of the grid lines.
See also
Other graphical elements:
ternary_axis(),
ternary_box(),
ternary_pairs(),
ternary_plot(),
ternary_title()
Examples
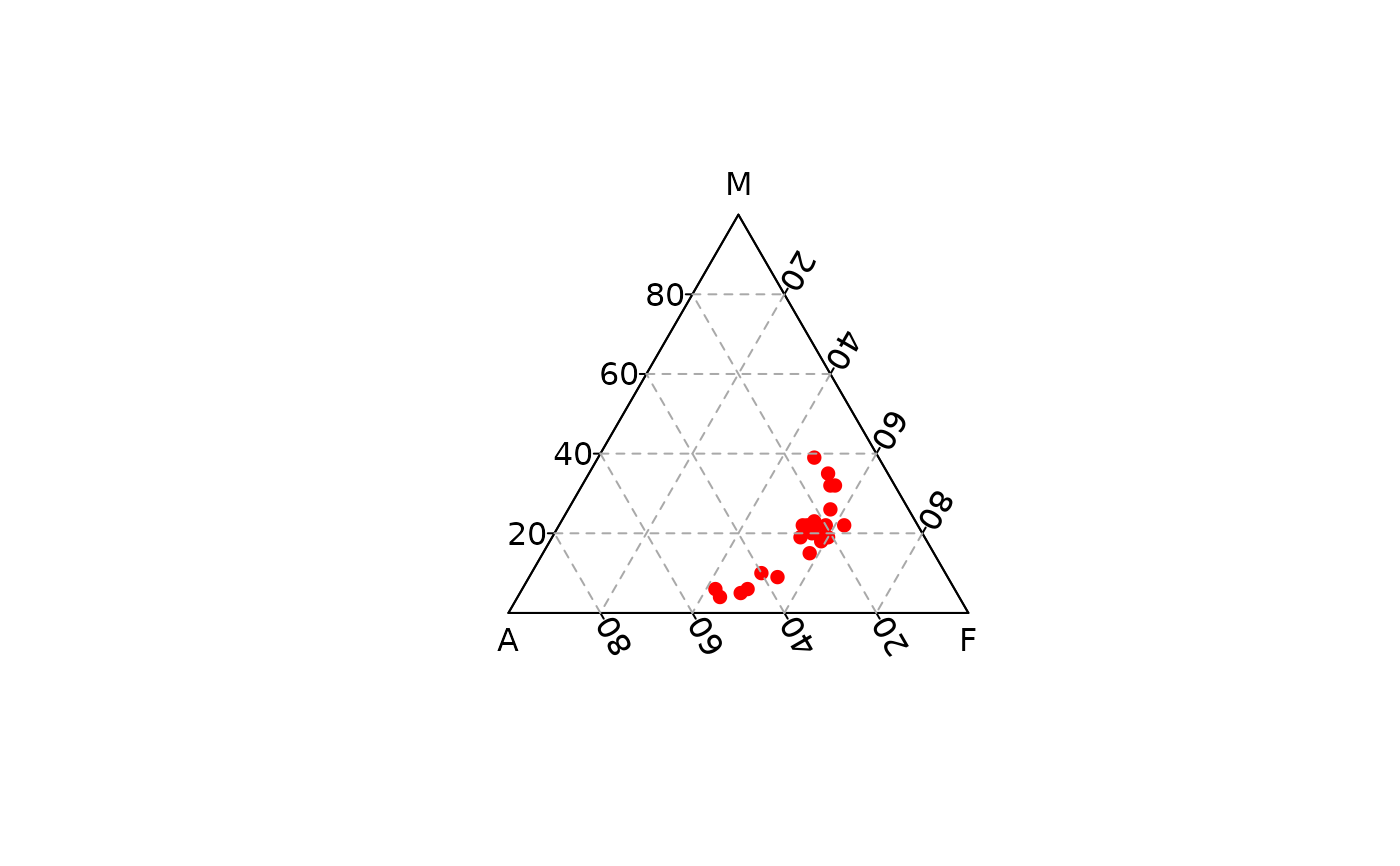
## Data from Aitchison 1986
ternary_plot(lava, center = FALSE, scale = FALSE, col = "red", pch = 16)
ternary_grid(5)
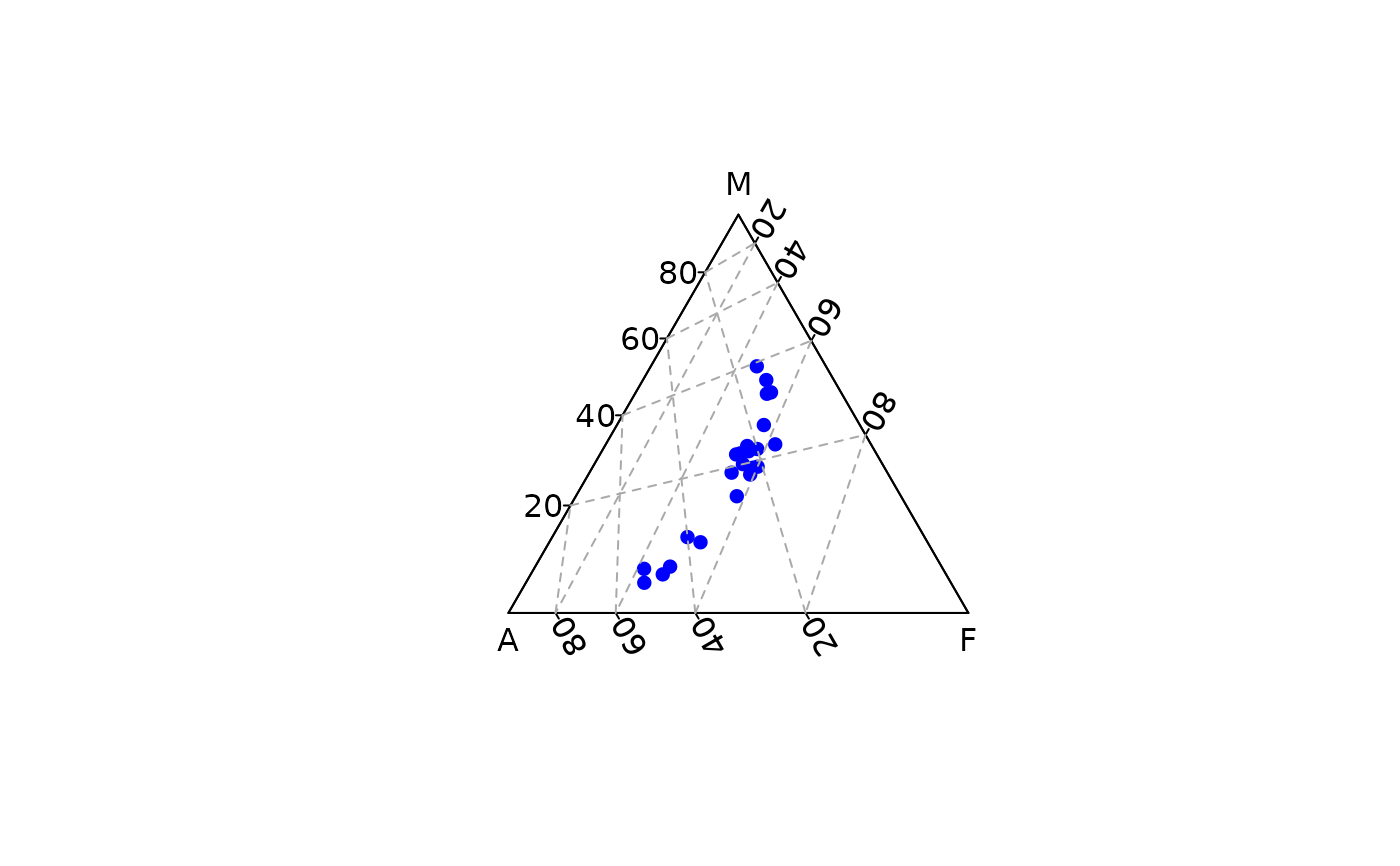
 ## Center
z <- ternary_plot(lava, center = TRUE, col = "blue", pch = 16)
ternary_grid(5, center = z$center)
## Center
z <- ternary_plot(lava, center = TRUE, col = "blue", pch = 16)
ternary_grid(5, center = z$center)
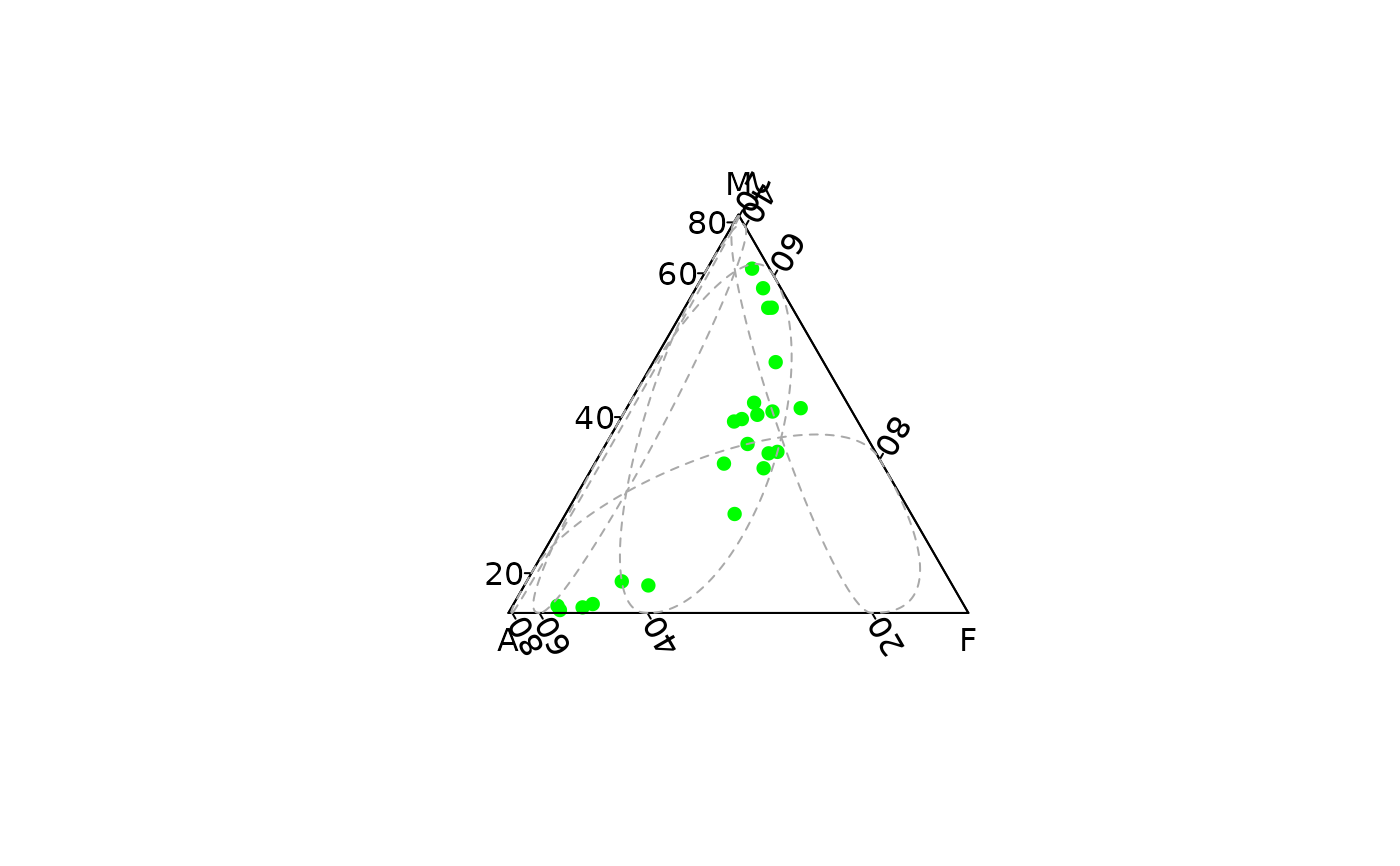
 ## Center and scale
z <- ternary_plot(lava, center = TRUE, scale = TRUE, col = "green", pch = 16)
ternary_grid(5, center = z$center, scale = z$scale)
## Center and scale
z <- ternary_plot(lava, center = TRUE, scale = TRUE, col = "green", pch = 16)
ternary_grid(5, center = z$center, scale = z$scale)