Creates an interval or a stratigraphic graph.
Usage
as_graph(edges, ...)

# S4 method for class 'data.frame'
as_graph(
  edges,
  type = c("interval", "stratigraphy"),
  direction = c("above", "below"),
  simplify = TRUE,
  reduce = TRUE,
  verbose = getOption("aion.verbose"),
  ...
)

# S4 method for class 'matrix'
as_graph(
  edges,
  type = c("interval", "stratigraphy"),
  direction = c("above", "below"),
  simplify = TRUE,
  reduce = TRUE,
  verbose = getOption("aion.verbose"),
  ...
)

# S4 method for class 'TimeIntervals'
as_graph(
  edges,
  type = c("interval", "stratigraphy"),
  simplify = TRUE,
  reduce = TRUE,
  verbose = getOption("aion.verbose"),
  ...
)
Arguments
- edges
A
TimeIntervalsobject or a two-columnscharactermatrixof edges (i.e. where each row specifies one relation element).- ...
Currently not used.
- type
A
characterstring specifying the type of the graph to be computed. It must be one of "interval" (the default) or "stratigraphy" (see details). Any unambiguous substring can be given.- direction
A
characterstring specifying the direction of the relations inx. It must be one of "above" (the default) or "below" (see details). Any unambiguous substring can be given. Only used iftypeis "stratigraphy".- simplify
A
logicalscalar: should multiple edges and loop edges be removed?- reduce
A
logicalscalar: should transitive reduction be performed? Only used iftypeis "stratigraphy".
Details
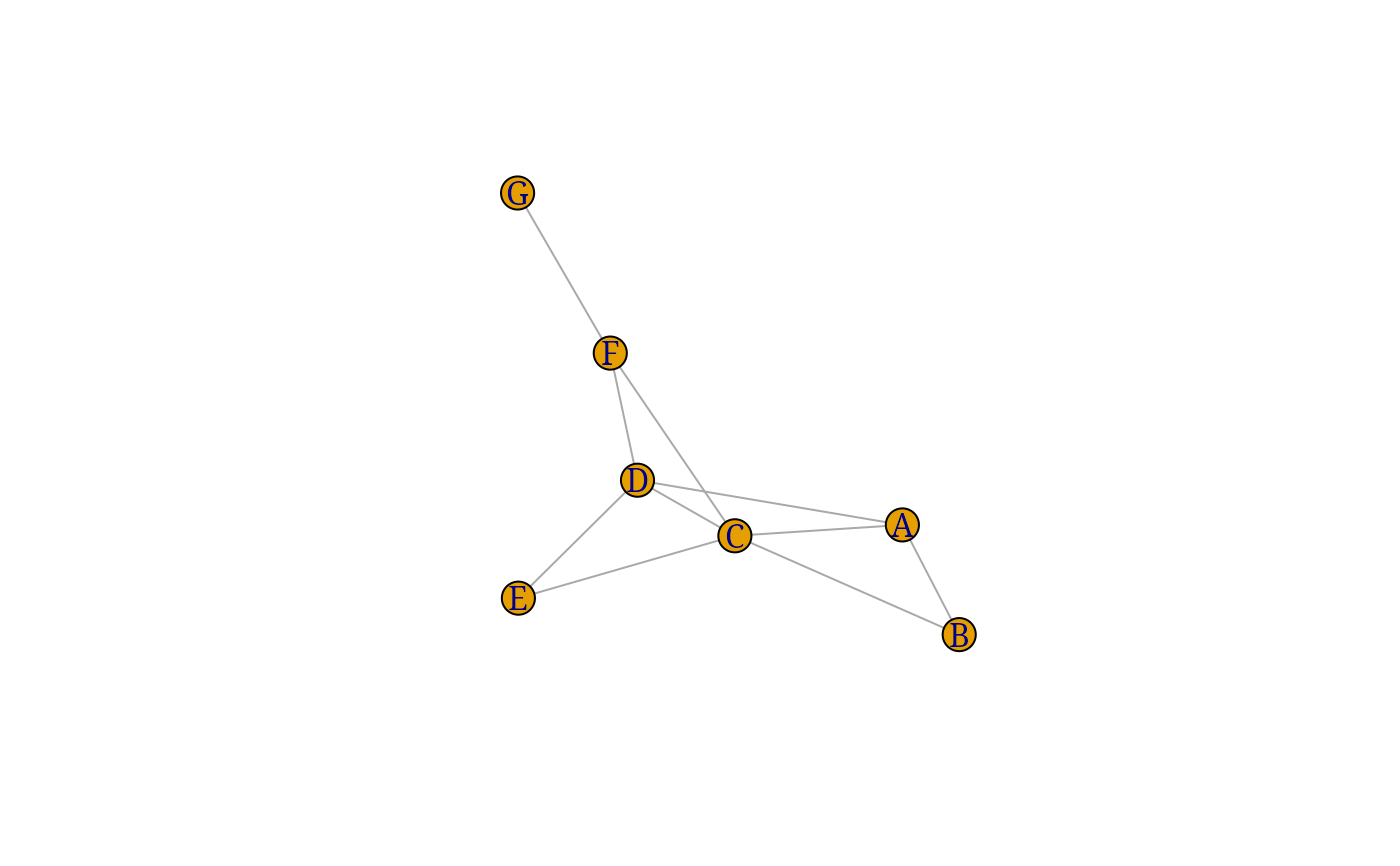
intervalAn interval graph is the graph showing intersecting intervals on a line. As time is linear and not circular, an interval graph contains no cycles with more than three edges and no shortcuts (it must be a chordal graph).
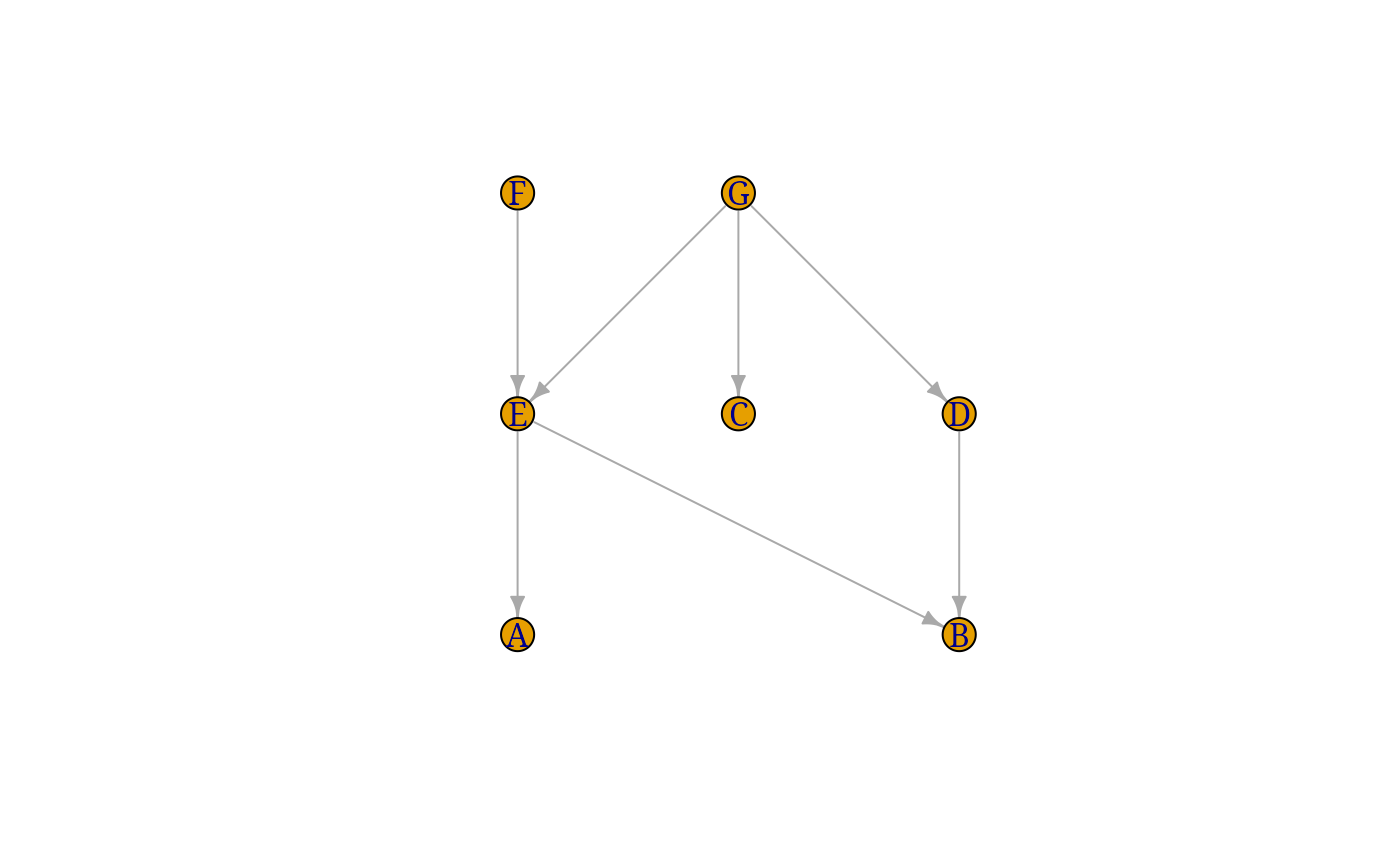
stratigraphyA stratigraphic graph represents directed relationships between (stratigraphic) units (it must be a directed acyclic graph).
Note
Experimental: might change in a future release.
The igraph and relations packages needs to be installed on your machine.
Examples
if (requireNamespace("igraph", quietly = TRUE) &&
    requireNamespace("relations", quietly = TRUE)) {
  ## Seven intervals
  int <- intervals(
    start = c(1, 2, 3, 6, 9, 13, 17),
    end = c(7, 4, 15, 14, 11, 18, 19),
    calendar = CE(),
    names = c("A", "B", "C", "D", "E", "F", "G")
  )

  ## Interval graph
  g <- as_graph(int, type = "interval")
  plot(g)

  ## Stratigraphic graph
  g <- as_graph(int, type = "strati")
  plot(g, layout = igraph::layout_with_sugiyama)
}