

![]()
Overview
alkahest is a lightweight, dependency-free toolbox for pre-processing XY data from experimental methods (i.e. any signal that can be measured along a continuous variable). It provides methods for baseline estimation and correction, smoothing, normalization, integration and peaks detection.
- Baseline estimation methods: Linear, Polynomial (Lieber and Mahadevan-Jansen 2003), Asymmetric Least Squares (Eilers and Boelens 2005), Rolling Ball (Kneen and Annegarn 1996), Rubberband, SNIP (Morháč et al. 1997; Morháč and Matoušek 2008; Ryan et al. 1988), 4S Peak Filling (Liland 2015).
- Smoothing methods: Rectangular, Triangular, Loess, Savitzky-Golay Filter (Gorry 1990; Savitzky and Golay 1964), Whittaker (Eilers 2003), Penalized Likelihood (De Rooi et al. 2014)
To cite alkahest in publications use:
Frerebeau N (2025). alkahest: Pre-Processing XY Data from Experimental Methods. Université Bordeaux Montaigne, Pessac, France. doi:10.5281/zenodo.7081524 https://doi.org/10.5281/zenodo.7081524, R package version 1.3.0, https://packages.tesselle.org/alkahest/.
This package is a part of the tesselle project https://www.tesselle.org.
Installation
You can install the released version of alkahest from CRAN with:
install.packages("alkahest")And the development version from Codeberg with:
# install.packages("remotes")
remotes::install_git("https://codeberg.org/tesselle/alkahest")
Usage
alkahest expects the input data to be in the simplest form (a two-column matrix or data frame, a two-element list or two numeric vectors).
## X-ray diffraction
data("XRD")

## 4S Peak Filling baseline
baseline <- baseline_peakfilling(XRD, n = 10, m = 5, by = 10, sparse = TRUE)

plot(XRD, type = "l", xlab = expression(2*theta), ylab = "Count")
lines(baseline, type = "l", col = "red")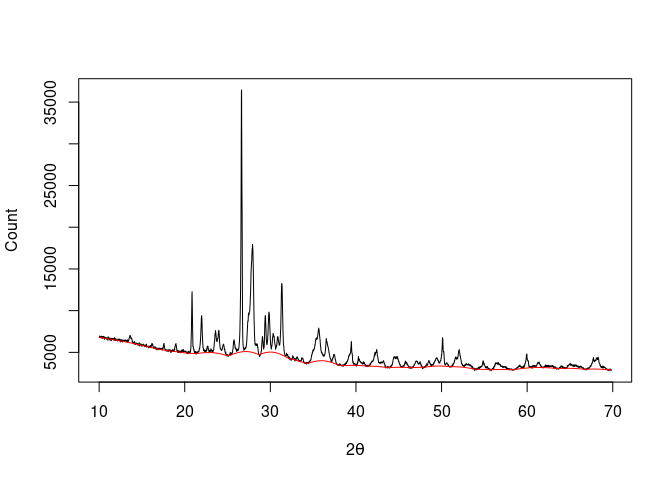
## Correct baseline
XRD <- signal_drift(XRD, lag = baseline, subtract = TRUE)

## Find peaks
peaks <- peaks_find(XRD, SNR = 3, m = 11)

plot(XRD, type = "l", xlab = expression(2*theta), ylab = "Count")
lines(peaks, type = "p", pch = 16, col = "red")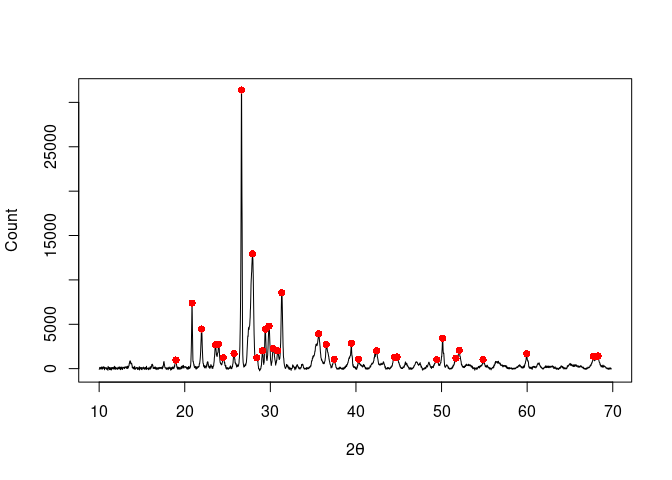
## Simulate data
set.seed(12345)
x <- seq(-4, 4, length = 100)
y <- dnorm(x)
z <- y + rnorm(100, mean = 0, sd = 0.01) # Add some noise
## Plot raw data
plot(x, z, type = "l", xlab = "", ylab = "", main = "Raw data")
lines(x, y, type = "l", lty = 2, col = "red")
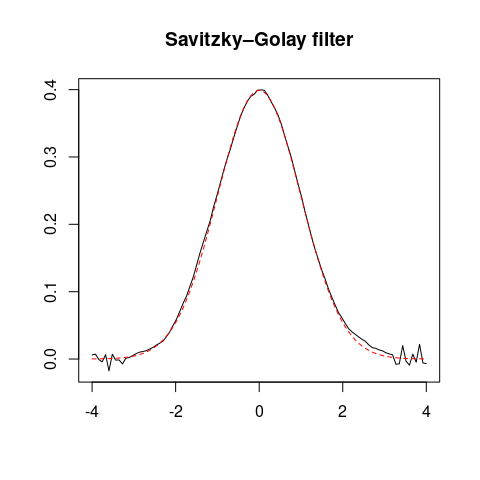
## Savitzky–Golay filter
smooth <- smooth_savitzky(x, z, m = 21, p = 2)
plot(smooth, type = "l", xlab = "", ylab = "", main = "Savitzky–Golay filter")
lines(x, y, type = "l", lty = 2, col = "red")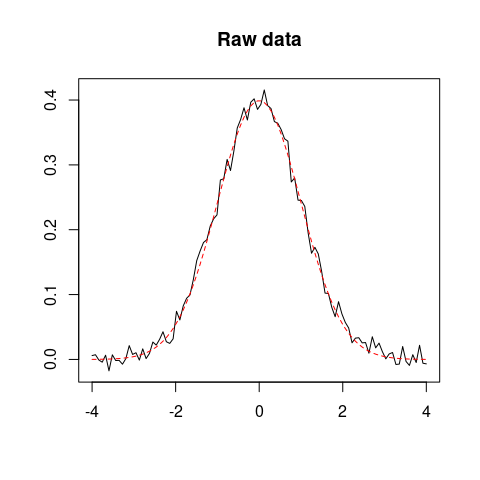
Contributing
Please note that the alkahest project is released with a Contributor Code of Conduct. By contributing to this project, you agree to abide by its terms.