Rolling Ball Baseline Estimation
Usage
baseline_rollingball(x, y, ...)

# S4 method for class 'numeric,numeric'
baseline_rollingball(x, y, m, s)

# S4 method for class 'ANY,missing'
baseline_rollingball(x, m, s)
Arguments
- x, y
A
numericvector. Ifyis missing, an attempt is made to interpretxin a suitable way (seegrDevices::xy.coords()).- ...
Currently not used.
- m
An odd
integergiving the window size (i.e. the number of adjacent points to be used; seewindow_sliding()) for minimization/maximization.- s
An odd
integergiving the window size (i.e. the number of adjacent points to be used; seewindow_sliding()) for smoothing.
Value
Returns a list with two components x and y.
Note
There will be \((m - 1) / 2\) points both at the beginning and at the end of the data series for which a complete \(m\)-width window cannot be obtained. To prevent data loss, progressively wider/narrower windows are used at both ends of the data series.
References
Kneen, M. A. and Annegarn, H. J. (1996). Algorithm for Fitting XRF, SEM and PIXE X-Ray Spectra Backgrounds. Nuclear Instruments and Methods in Physics Research Section B: Beam Interactions with Materials and Atoms, 109/110: 209-213. doi:10.1016/0168-583X(95)00908-6 .
See also
Other baseline estimation methods:
baseline_asls(),
baseline_linear(),
baseline_peakfilling(),
baseline_polynomial(),
baseline_rubberband(),
baseline_snip()
Examples
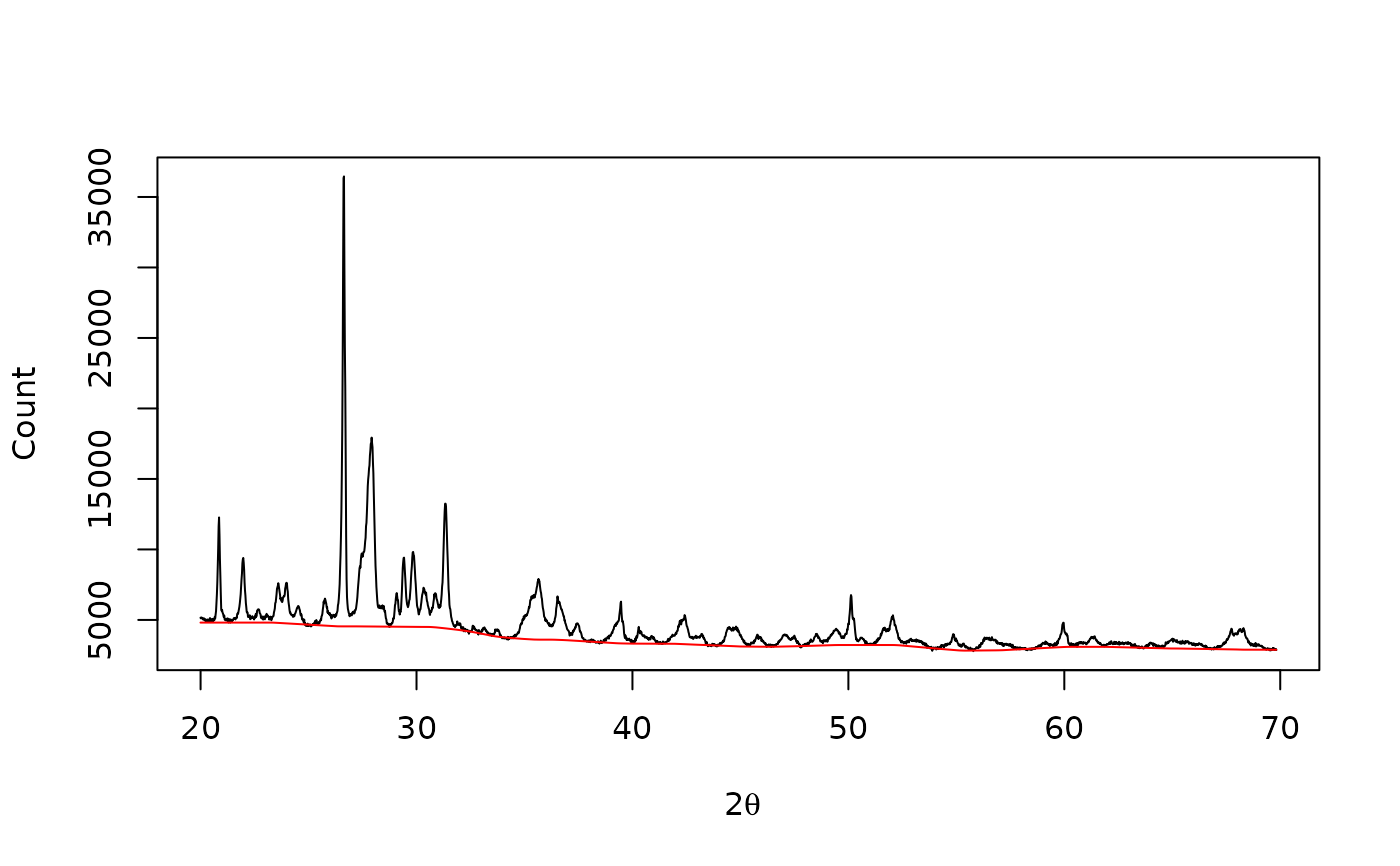
## X-ray diffraction
data("XRD")

## Subset from 20 to 70 degrees
XRD <- signal_select(XRD, from = 20, to = 70)

## Plot spectrum
plot(XRD, type = "l", xlab = expression(2*theta), ylab = "Count")

## Rolling Ball baseline
baseline <- baseline_rollingball(XRD, m = 201, s = 151)

plot(XRD, type = "l", xlab = expression(2*theta), ylab = "Count")
lines(baseline, type = "l", col = "red")