Sensitive Nonlinear Iterative Peak clipping algorithm.
Usage
baseline_snip(x, y, ...)

# S4 method for class 'numeric,numeric'
baseline_snip(x, y, LLS = FALSE, decreasing = FALSE, n = 100)

# S4 method for class 'ANY,missing'
baseline_snip(x, LLS = FALSE, decreasing = FALSE, n = 100)
Arguments
- x, y
A
numericvector. Ifyis missing, an attempt is made to interpretxin a suitable way (seegrDevices::xy.coords()).- ...
Currently not used.
- LLS
A
logicalscalar: should the LLS operator be applied onxbefore employing SNIP algorithm? Only used ifmethodis "SNIP".- decreasing
A
logicalscalar: should a decreasing clipping window be used?- n
An
integervalue giving the number of iterations.
Value
Returns a list with two components x and y.
References
Morháč, M., Kliman, J., Matoušek, V., Veselský, M. & Turzo, I. (1997). Background elimination methods for multidimensional gamma-ray spectra. Nuclear Instruments and Methods in Physics Research Section A: Accelerators, Spectrometers, Detectors and Associated Equipment, 401(1), p. 113-132. doi:10.1016/S0168-9002(97)01023-1
Morháč, M. & Matoušek, V. (2008). Peak Clipping Algorithms for Background Estimation in Spectroscopic Data. Applied Spectroscopy, 62(1), p. 91-106. doi:10.1366/000370208783412762
Ryan, C. G., Clayton, E., Griffin, W. L., Sie, S. H. & Cousens, D. R. (1988). SNIP, a statistics-sensitive background treatment for the quantitative analysis of PIXE spectra in geoscience applications. Nuclear Instruments and Methods in Physics Research Section B: Beam Interactions with Materials and Atoms, 34(3), p. 396-402. doi:10.1016/0168-583X(88)90063-8
See also
Other baseline estimation methods:
baseline_asls(),
baseline_linear(),
baseline_peakfilling(),
baseline_polynomial(),
baseline_rollingball(),
baseline_rubberband()
Examples
## gamma-ray spectrometry
data("BEGe")
## Subset from 2.75 to 200 keV
BEGe <- signal_select(BEGe, from = 3, to = 200)
## Plot spectrum
plot(BEGe, type = "l", xlab = "Energy (keV)", ylab = "Count")
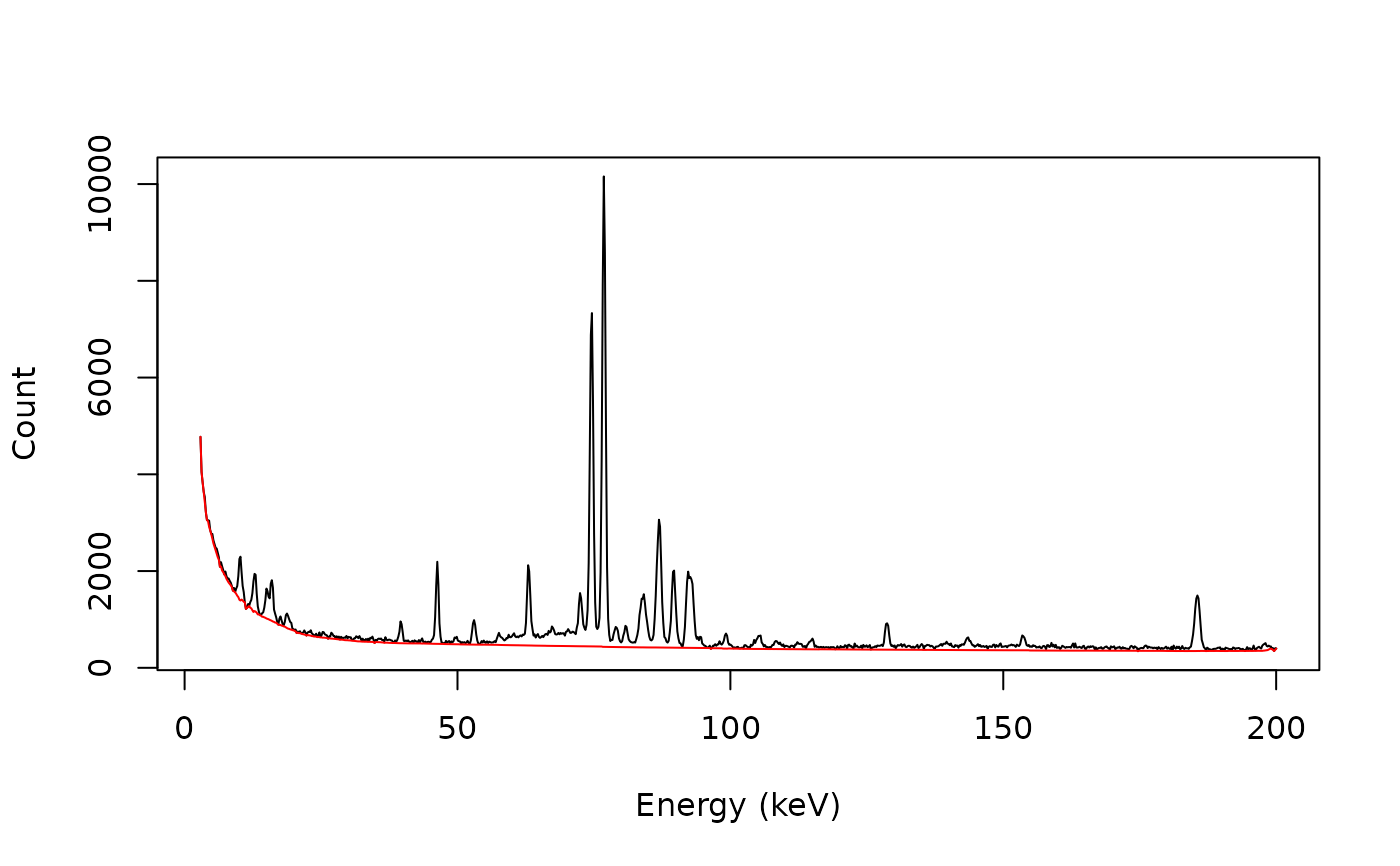
## SNIP baseline
baseline <- baseline_snip(BEGe, LLS = FALSE, decreasing = FALSE, n = 100)
plot(BEGe, type = "l", xlab = "Energy (keV)", ylab = "Count")
lines(baseline, type = "l", col = "red")