Represents layer-counted proxy records as sequences of probability distributions on absolute, error-free time axes.
Arguments
- positions
A positive
numericvector giving the positions (e.g. depths) at which proxy values and calendar ages were measured. In the case of layers of non-zero thickness, this should be the middle value of the slice. It must be in decreasing order (i.e. in chronological order).- ...
Currently not used.
- proxy_values
A
numericvector giving the proxy values.- proxy_errors
A
numericvector giving the proxy uncertainties.- proxy_step
A length-one
numericvector specifying the step size (in units ofproxy_values) at which proxy records densities are to be estimated.- time_values
A
numericvector giving the calendar ages (in years).- time_errors
A
numericvector giving the calendar age uncertainties (in years).- calendar
An
aion::TimeScaleobject specifying the calendar oftime(seeaion::calendar()).- from
A length-one
numericvector specifying the starting value of the temporal sequence at which densities are to be estimated (in years).- to
A length-one
numericvector specifying the end value of the temporal sequence at which densities are to be estimated (in cal BP years).- by
A length-one
numericvector specifying the increment of the temporal sequence at which densities are to be estimated (in years).- n
An
integerspecifying the number of item to choose randomly.- progress
A
logicalscalar: should a progress bar be displayed?- verbose
A
logicalscalar: should extra information be reported?
Value
A ProxyRecord object.
References
Boers, N., Goswami, B. & Ghil, M. (2017). A Complete Representation of Uncertainties in Layer-Counted Paleoclimatic Archives. Climate of the Past, 13(9): 1169-1180. doi:10.5194/cp-13-1169-2017 .
See also
Other proxy tools:
proxy_plot
Examples
# \donttest{
## Get NGRIP records
data("ngrip2010", package = "folio")
ngrip2010 <- subset(ngrip2010, !is.na(MCE))
ngrip2010 <- ngrip2010[nrow(ngrip2010):1, ] # Sort in chronological order
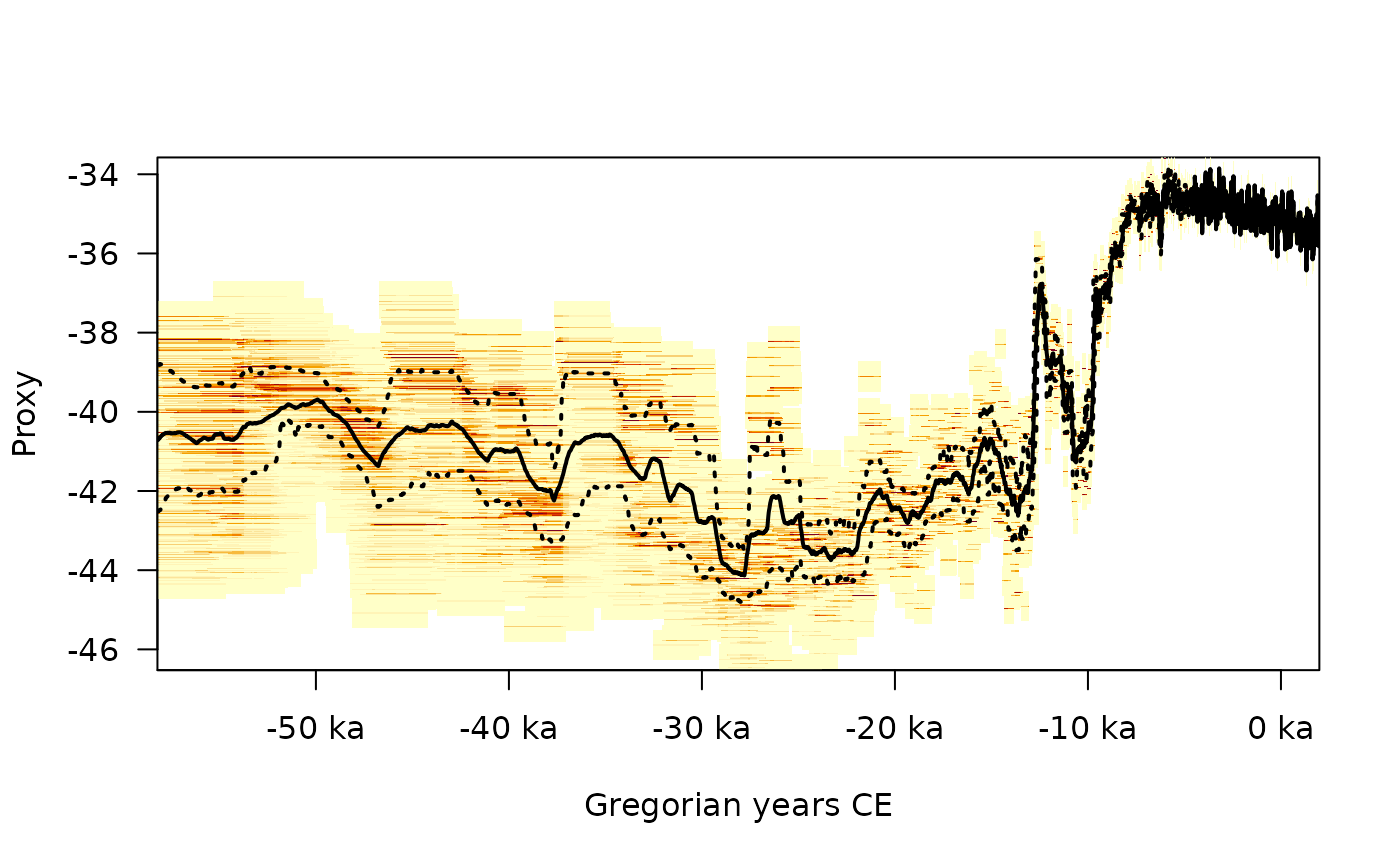
## Replicate fig. 3d from Boers et al. (2017)
## /!\ This may take a while... /!\
ngrip_record <- proxy_ensemble(
positions = ngrip2010$depth,
proxy_values = ngrip2010$delta,
proxy_errors = 0.01,
proxy_step = 0.01,
time_values = ngrip2010$age,
time_errors = ngrip2010$MCE,
calendar = b2k(), # /!\
by = 20,
n = 30
)
plot(ngrip_record)
 # }
# }