Plot Layer-Counted Proxy Records Uncertainties
Usage
# S4 method for class 'ProxyRecord,missing'
plot(
  x,
  calendar = get_calendar(),
  iqr = TRUE,
  xlab = NULL,
  ylab = NULL,
  col = grDevices::hcl.colors(12, "YlOrRd", rev = TRUE),
  col.mean = "black",
  col.iqr = col.mean,
  lty.mean = 1,
  lty.iqr = 3,
  lwd.mean = 2,
  lwd.iqr = lwd.mean,
  ...
)
Arguments
- x
A
ProxyRecordobject.- calendar
An
aion::TimeScaleobject specifying the target calendar (seeaion::calendar()). IfNULL, rata die are returned.- iqr
A
logicalscalar: should the mean and IQR be displayed?- xlab, ylab
A
characterstring giving a label for the x and y axis.- col
A list of colors such as that generated by
grDevices::hcl.colors().- col.mean, col.iqr
A specification for the line colors. Only used if
iqrisTRUE.- lty.mean, lty.iqr
A specification for the line types. Only used if
iqrisTRUE.- lwd.mean, lwd.iqr
A specification for the line widths. Only used if
iqrisTRUE.- ...
Further parameters to be passed to
graphics::image().
Value
plot() is called it for its side-effects: it results in a graphic
being displayed. Invisibly returns x.
See also
Other proxy tools:
proxy_ensemble()
Examples
# \donttest{
## Get NGRIP records
data("ngrip2010", package = "folio")
ngrip2010 <- subset(ngrip2010, !is.na(MCE))
ngrip2010 <- ngrip2010[nrow(ngrip2010):1, ] # Sort in chronological order
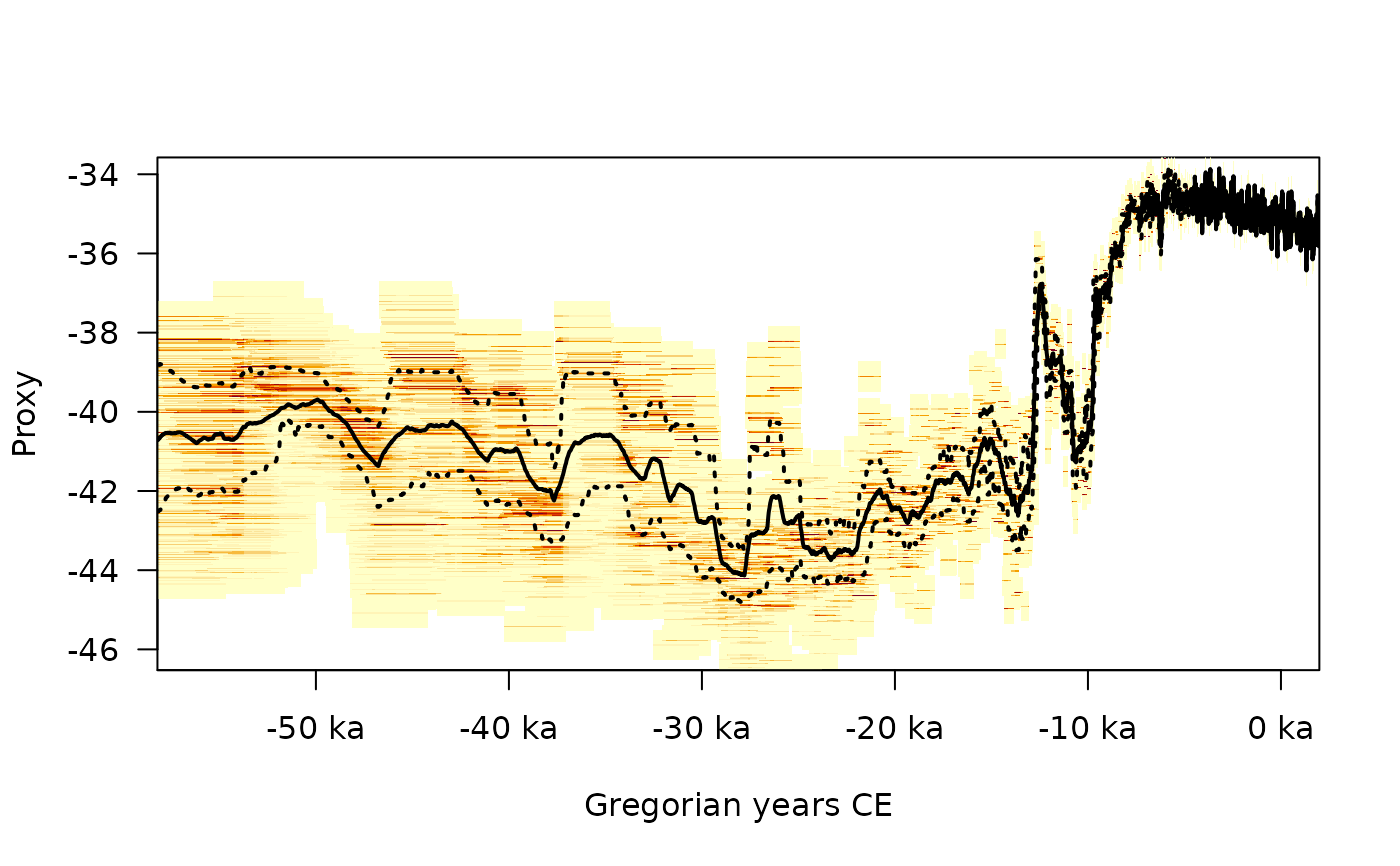
## Replicate fig. 3d from Boers et al. (2017)
## /!\ This may take a while... /!\
ngrip_record <- proxy_ensemble(
positions = ngrip2010$depth,
proxy_values = ngrip2010$delta,
proxy_errors = 0.01,
proxy_step = 0.01,
time_values = ngrip2010$age,
time_errors = ngrip2010$MCE,
calendar = b2k(), # /!\
by = 20,
n = 30
)
plot(ngrip_record)
 # }
# }