Compute tile values.
Usage
tile_bin(x, y, z, ...)

tile_density(x, y, z, ...)

tile_interpolate(x, y, z, ...)

# S4 method for class 'numeric,numeric,numeric'
tile_bin(x, y, z)

# S4 method for class 'ANY,missing,missing'
tile_bin(x)

# S4 method for class 'numeric,numeric,numeric'
tile_density(x, y, z)

# S4 method for class 'ANY,missing,missing'
tile_density(x)

# S4 method for class 'numeric,numeric,numeric'
tile_interpolate(x, y, z, value, method = "linear", ...)

# S4 method for class 'ANY,missing,missing'
tile_interpolate(x, value, method = "linear", ...)
Arguments
- x, y, z
A
numericvector giving the x, y and z ternary coordinates of a set of points. Ifyandzare missing, an attempt is made to interpretxin a suitable way (seegrDevices::xyz.coords()).- ...
Further parameters to be passed to internal methods.
- value
A
numericvector giving the values to be interpolated.- method
A
characterstring: specifying the method for interpolation (seeinterp::interp()).
Examples
## Data from Aitchison 1986
## Bin
f <- tile_bin(lava)
ternary_plot(NULL)
ternary_image(f = f, n = 12)
 ## Custom color palette
pal <- function(x) {
x <- (x - min(x)) / (max(x) - min(x)) # Rescale to [0,1]
YlOrBr <- c("#FFFFD4", "#FED98E", "#FE9929", "#D95F0E", "#993404")
RGB <- grDevices::colorRamp(YlOrBr)(x)
grDevices::rgb(RGB, maxColorValue = 255)
}
ternary_plot(NULL)
ternary_image(f = f, n = 12, palette = pal)
## Custom color palette
pal <- function(x) {
x <- (x - min(x)) / (max(x) - min(x)) # Rescale to [0,1]
YlOrBr <- c("#FFFFD4", "#FED98E", "#FE9929", "#D95F0E", "#993404")
RGB <- grDevices::colorRamp(YlOrBr)(x)
grDevices::rgb(RGB, maxColorValue = 255)
}
ternary_plot(NULL)
ternary_image(f = f, n = 12, palette = pal)
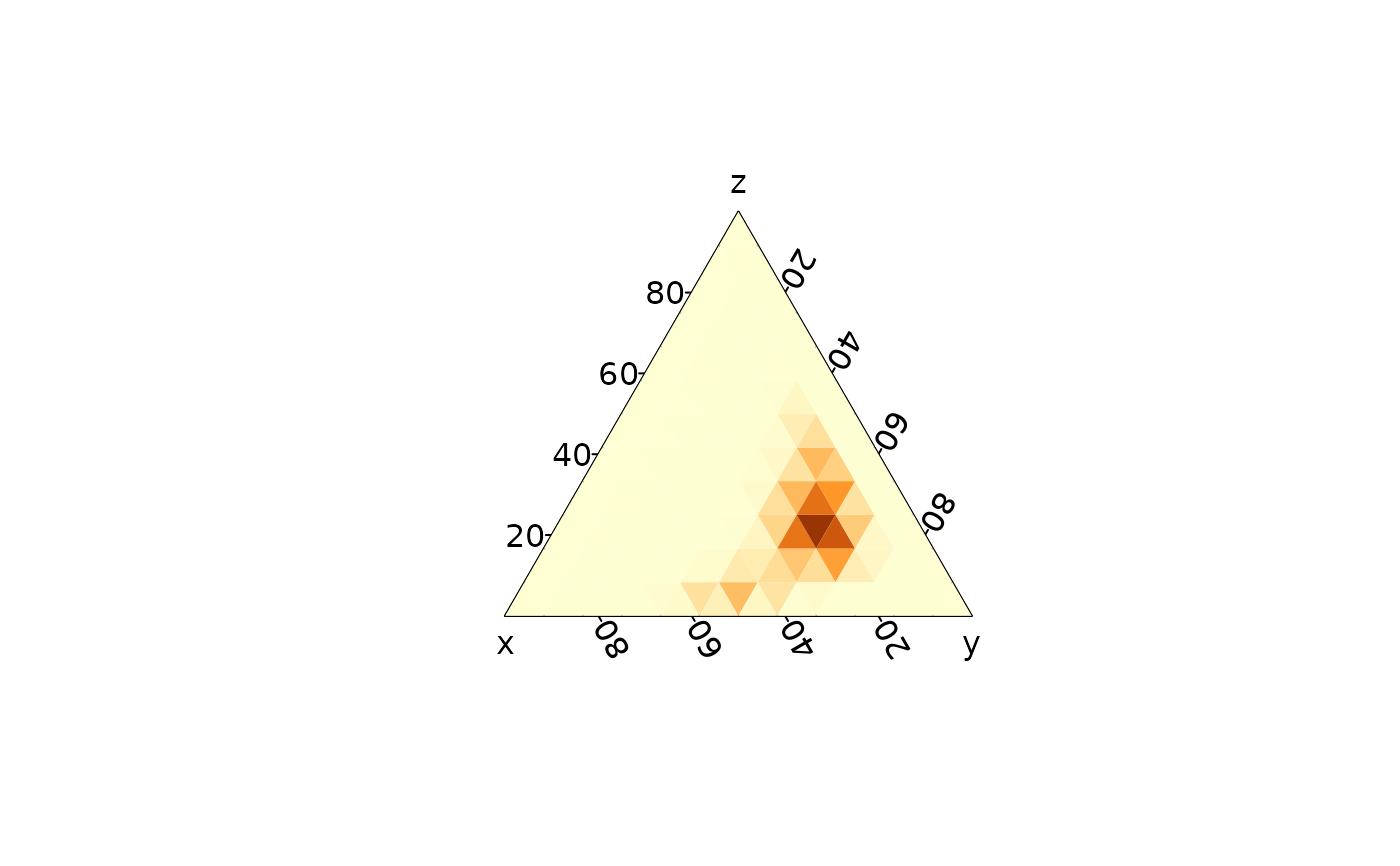
 ## Density
f <- tile_density(lava)
ternary_plot(NULL)
ternary_image(f = f, n = 12, palette = pal)
## Density
f <- tile_density(lava)
ternary_plot(NULL)
ternary_image(f = f, n = 12, palette = pal)
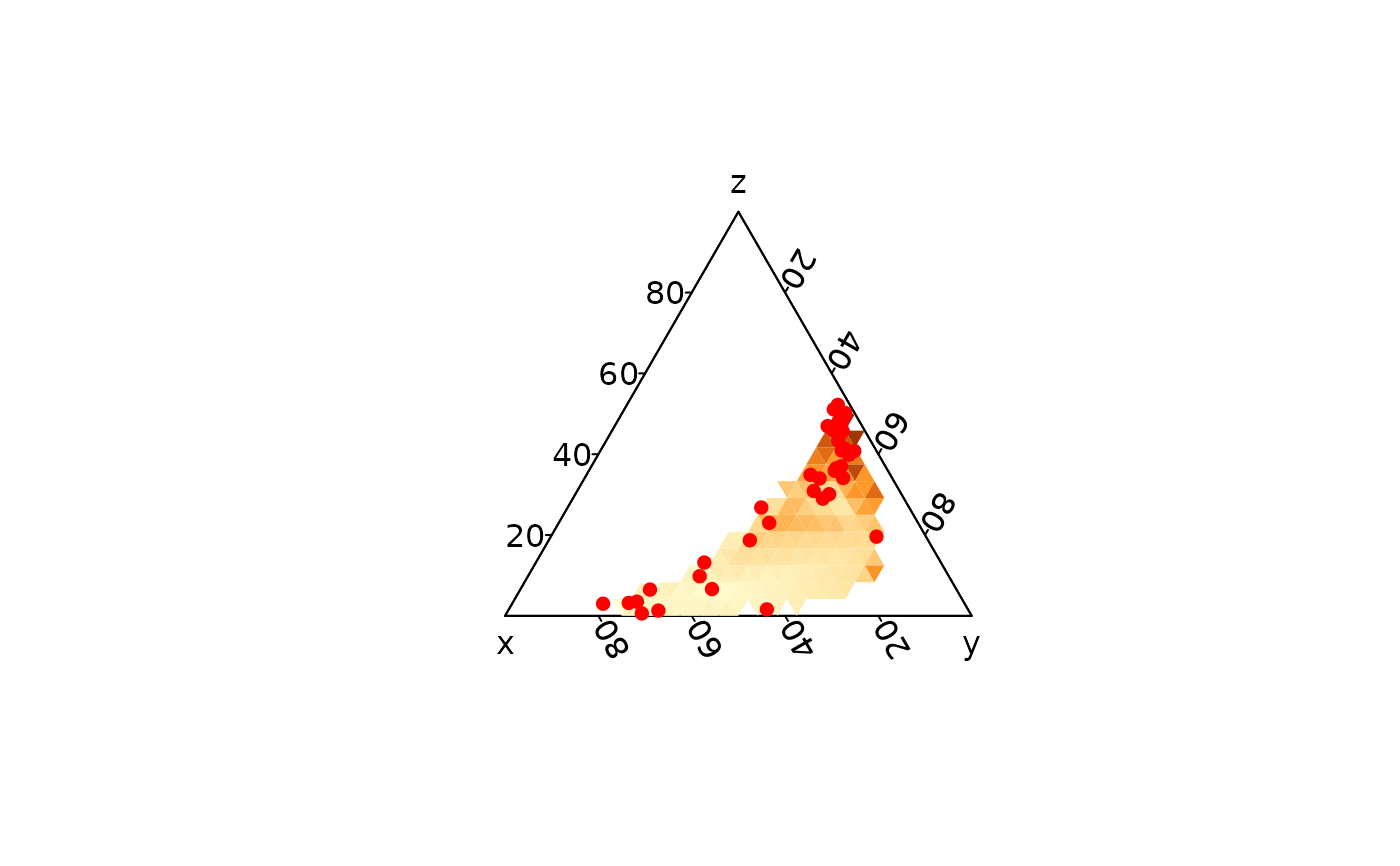
 if (requireNamespace("interp", quietly = TRUE)) {
## Interpolation
f <- tile_interpolate(arctic, value = arctic$depth)
ternary_plot(NULL)
ternary_image(f = f, n = 24, palette = pal)
ternary_points(arctic, col = "red", pch = 16)
}
if (requireNamespace("interp", quietly = TRUE)) {
## Interpolation
f <- tile_interpolate(arctic, value = arctic$depth)
ternary_plot(NULL)
ternary_image(f = f, n = 24, palette = pal)
ternary_points(arctic, col = "red", pch = 16)
}