Add Points to a Ternary Plot
Usage
ternary_points(x, y, z, ...)

# S4 method for class 'numeric,numeric,numeric'
ternary_points(x, y, z, center = FALSE, scale = FALSE, type = "p", ...)

# S4 method for class 'ANY,missing,missing'
ternary_points(x, center = FALSE, scale = FALSE, type = "p", ...)
Arguments
- x, y, z
A
numericvector giving the x, y and z ternary coordinates of a set of points. Ifyandzare missing, an attempt is made to interpretxin a suitable way (seegrDevices::xyz.coords()).- ...
Further graphical parameters (see
graphics::par()) may also be supplied as arguments, particularly, plotting character,pch, character expansion,cexand color,col.- center
A
logicalscalar specifying wether the data should be centered, or anumericvector giving the center.- scale
A
logicalscalar specifying wether the data should be scaled, or anumericvector giving the scale factor.- type
A
characterstring indicating the type of plotting; actually any of the types as ingraphics::plot.default().
Value
ternary_points() is called it for its side-effects. Invisibly returns
a list with the components:
x | A numeric vector of x values. |
y | A numeric vector of y values. |
z | A numeric vector of z values. |
center | A numeric vector giving the center. |
scale | A numeric vector giving the scale factor. |
Examples
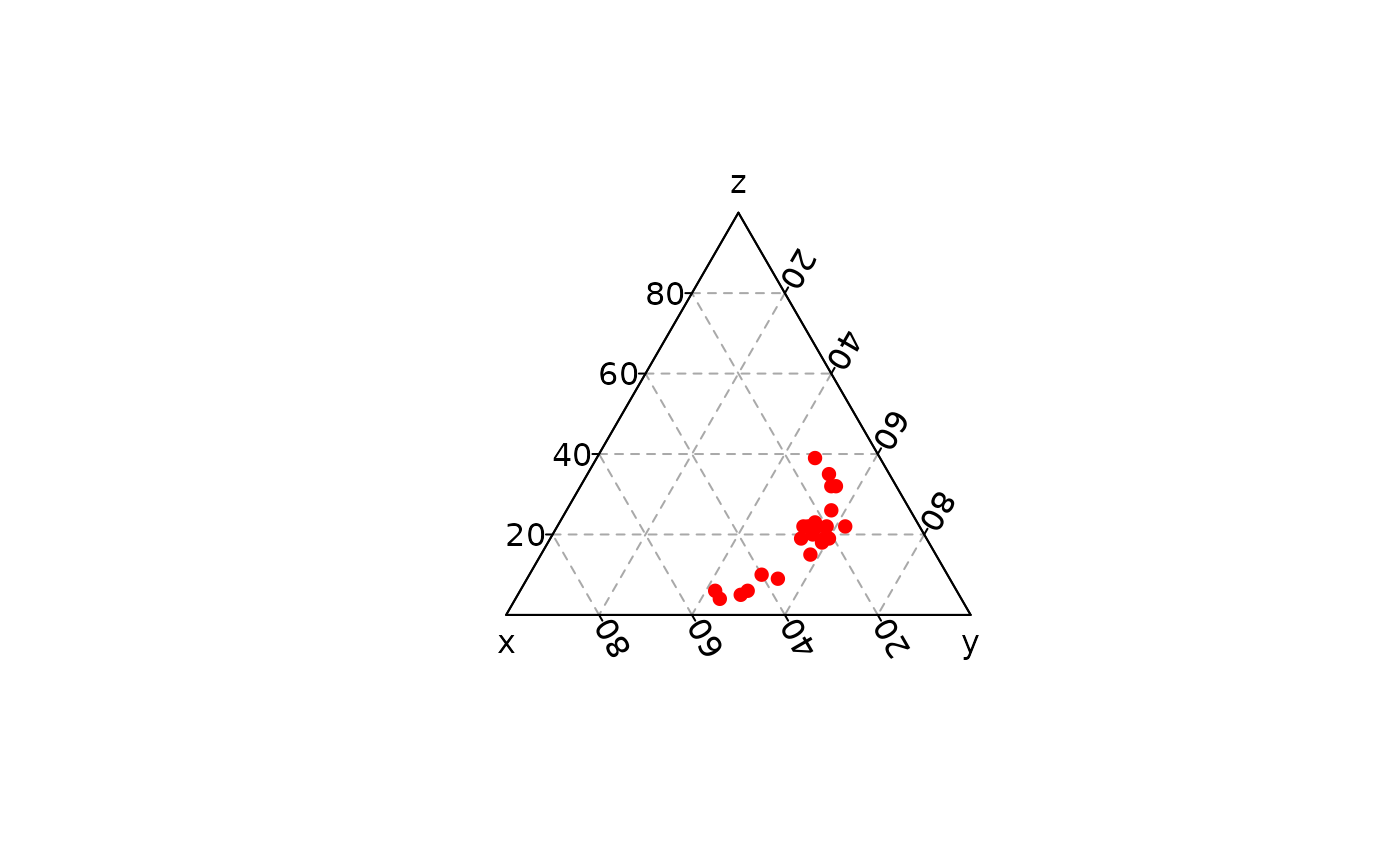
## Add points
## Data from Aitchison 1986
ternary_plot(NULL, panel.first = ternary_grid())
ternary_points(lava, col = "red", pch = 16)
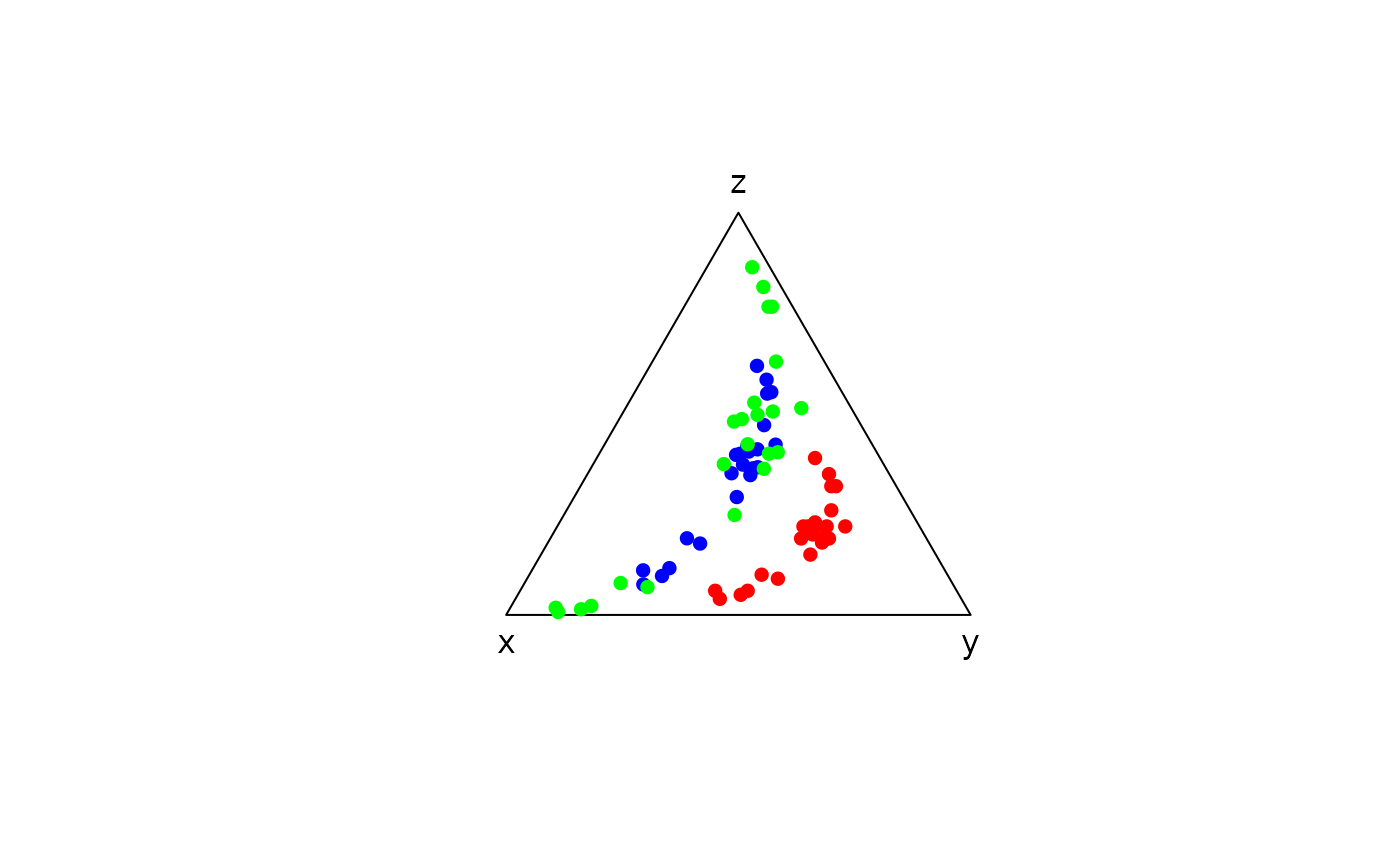
 ## Center and scale
ternary_plot(NULL, axes = FALSE, frame.plot = TRUE)
ternary_points(lava, col = "red", pch = 16)
ternary_points(lava, center = TRUE, col = "blue", pch = 16)
ternary_points(lava, center = TRUE, scale = TRUE, col = "green", pch = 16)
## Center and scale
ternary_plot(NULL, axes = FALSE, frame.plot = TRUE)
ternary_points(lava, col = "red", pch = 16)
ternary_points(lava, center = TRUE, col = "blue", pch = 16)
ternary_points(lava, center = TRUE, scale = TRUE, col = "green", pch = 16)