Add Connected Line Segments to a Ternary Plot
Source:R/AllGenerics.R, R/ternary_lines.R
ternary_lines.RdAdd Connected Line Segments to a Ternary Plot
Usage
ternary_lines(x, y, z, ...)

# S4 method for class 'numeric,numeric,numeric'
ternary_lines(x, y, z, type = "l", ...)

# S4 method for class 'ANY,missing,missing'
ternary_lines(x, type = "l", ...)
Arguments
- x, y, z
A
numericvector giving the x, y and z ternary coordinates of a set of points. Ifyandzare missing, an attempt is made to interpretxin a suitable way (seegrDevices::xyz.coords()).- ...
Further graphical parameters (see
graphics::par()) may also be supplied as arguments, particularly, line type,lty, line width,lwd, color,coland fortype = "b",pch. Also the line characteristicslend,ljoinandlmitre.- type
A
characterstring indicating the type of plotting; actually any of the types as ingraphics::plot.default().
Examples
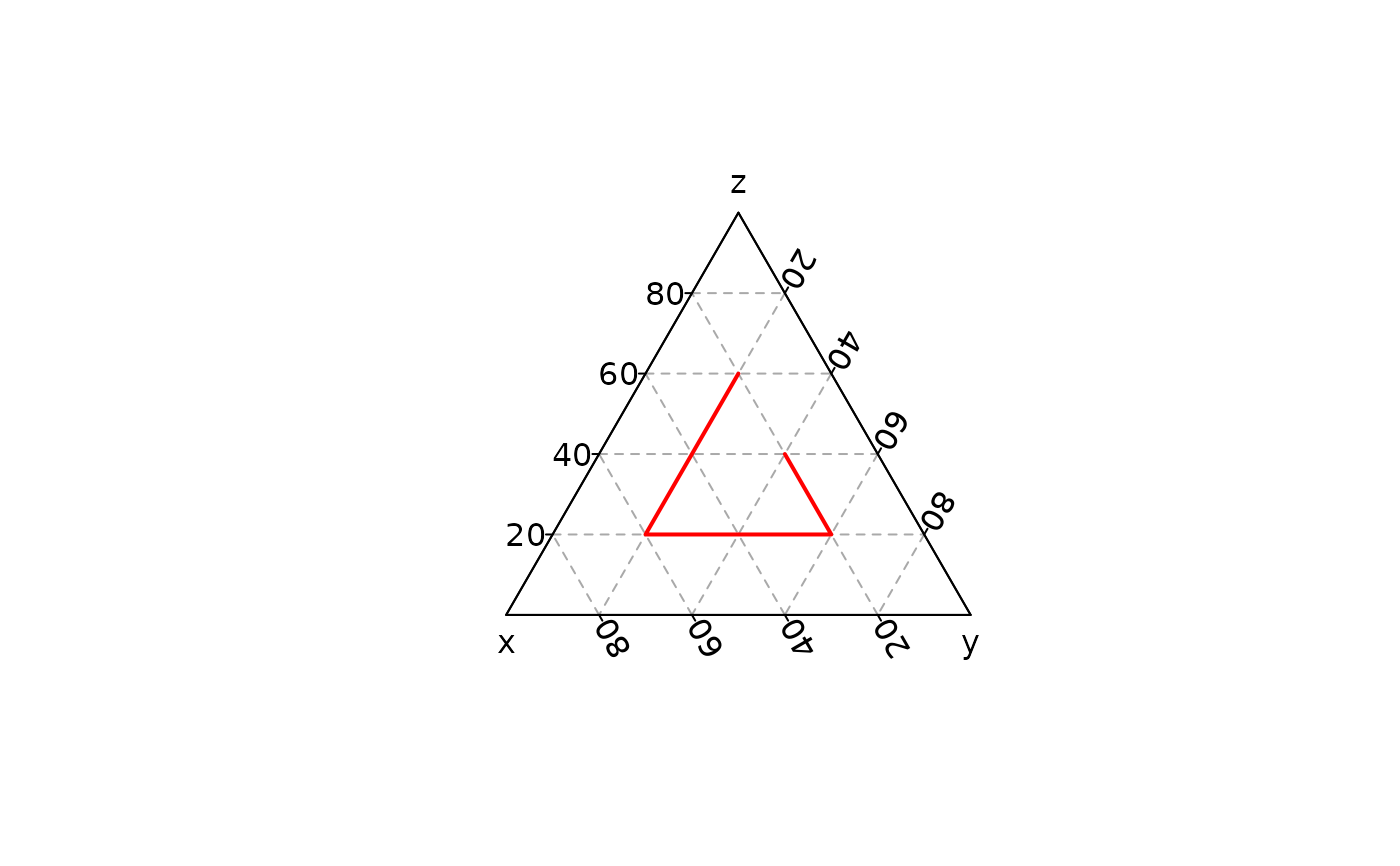
## Compositional data
coda <- data.frame(
  X = c(20, 60, 20, 20),
  Y = c(20, 20, 60, 40),
  Z = c(60, 20, 20, 40)
)

## Add lines
ternary_plot(NULL, panel.first = ternary_grid())
ternary_lines(coda, col = "red", lwd = 2)