Computes the rate of change from an aoristic analysis.
Arguments
- object
An
AoristicSumobject.- ...
Currently not used.
- n
A non-negative
integergiving the number of replications (see details).
Value
A RateOfChange object.
References
Baxter, M. J. & Cool, H. E. M. (2016). Reinventing the Wheel? Modelling Temporal Uncertainty with Applications to Brooch Distributions in Roman Britain. Journal of Archaeological Science, 66: 120-27. doi:10.1016/j.jas.2015.12.007 .
Crema, E. R. (2012). Modelling Temporal Uncertainty in Archaeological Analysis. Journal of Archaeological Method and Theory, 19(3): 440-61. doi:10.1007/s10816-011-9122-3 .
See also
Other aoristic analysis:
aoristic()
Examples
## Data from Husi 2022
data("loire", package = "folio")
## Get time range
loire_range <- loire[, c("lower", "upper")]
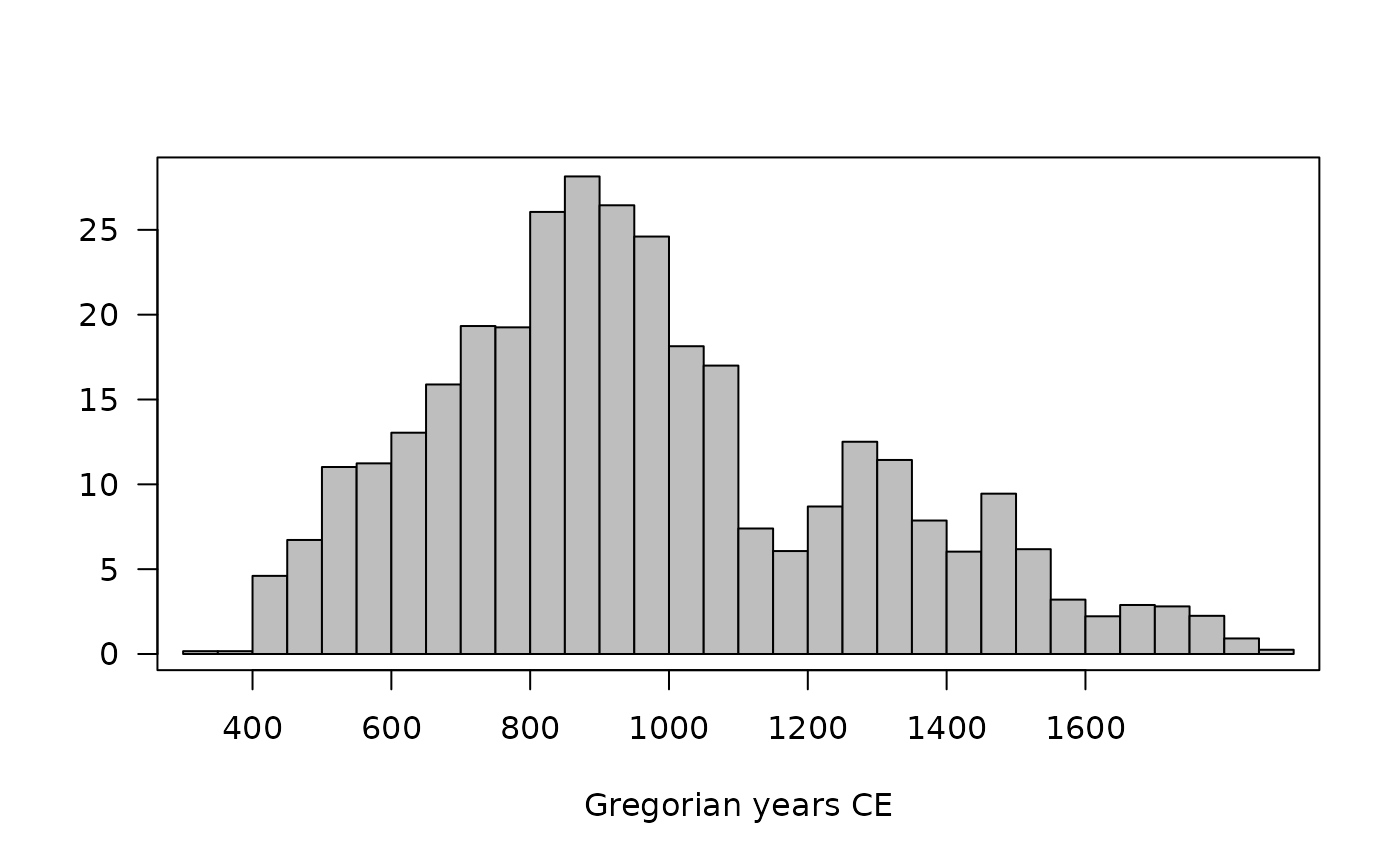
## Calculate aoristic sum (normal)
aorist_raw <- aoristic(loire_range, step = 50, weight = FALSE)
plot(aorist_raw, col = "grey")
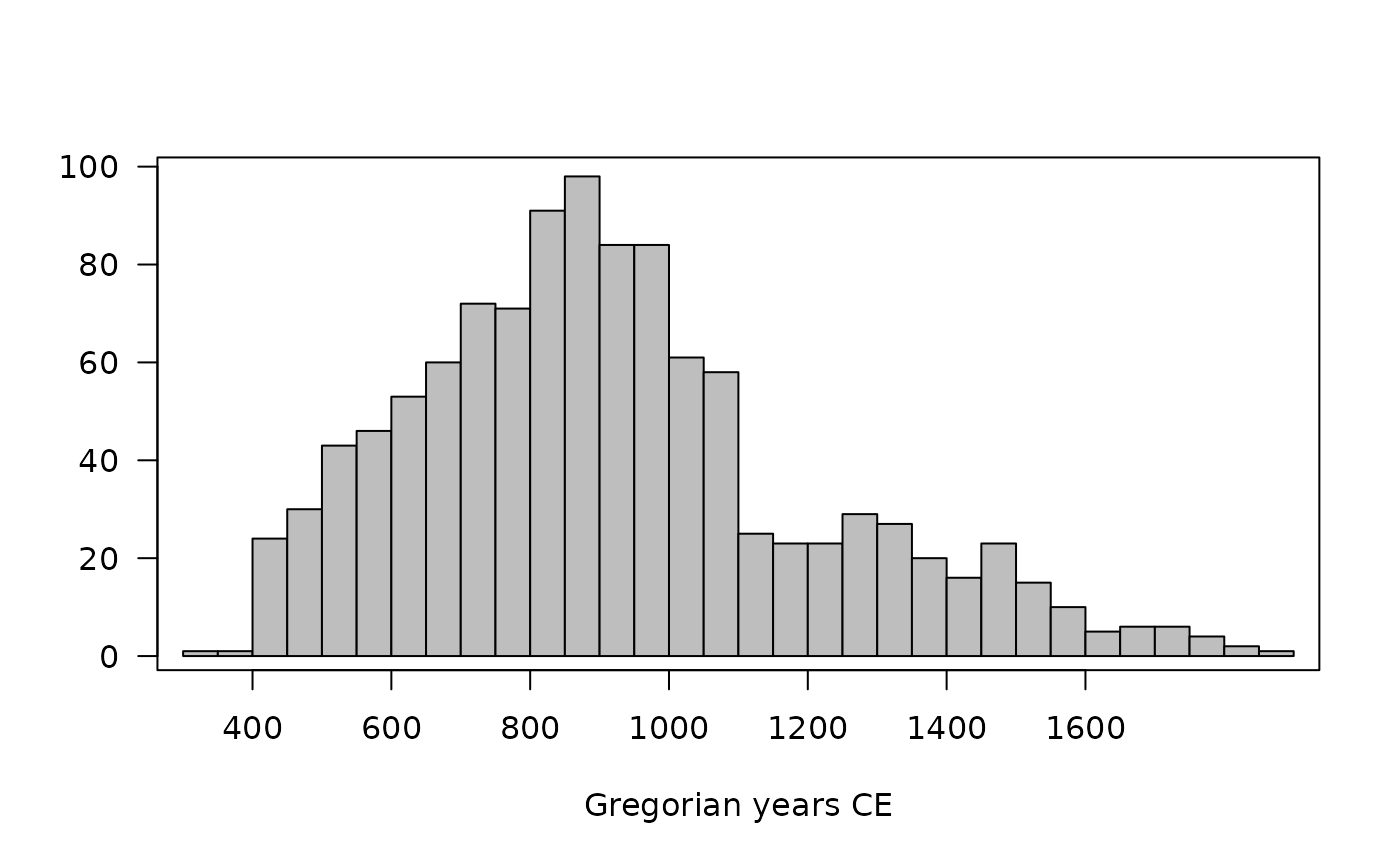 ## Calculate aoristic sum (weights)
aorist_weighted <- aoristic(loire_range, step = 50, weight = TRUE)
plot(aorist_weighted, col = "grey")
## Calculate aoristic sum (weights)
aorist_weighted <- aoristic(loire_range, step = 50, weight = TRUE)
plot(aorist_weighted, col = "grey")
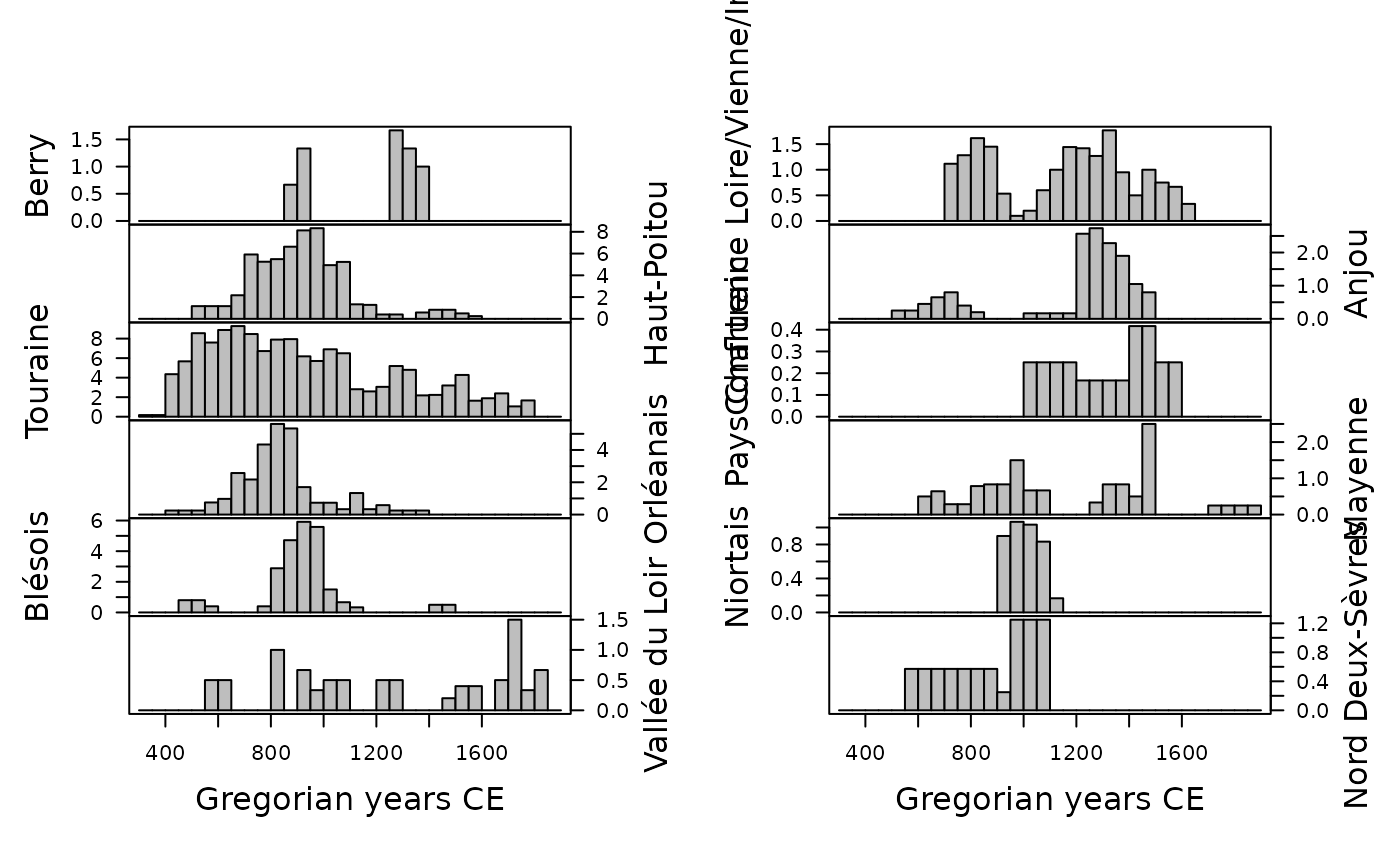
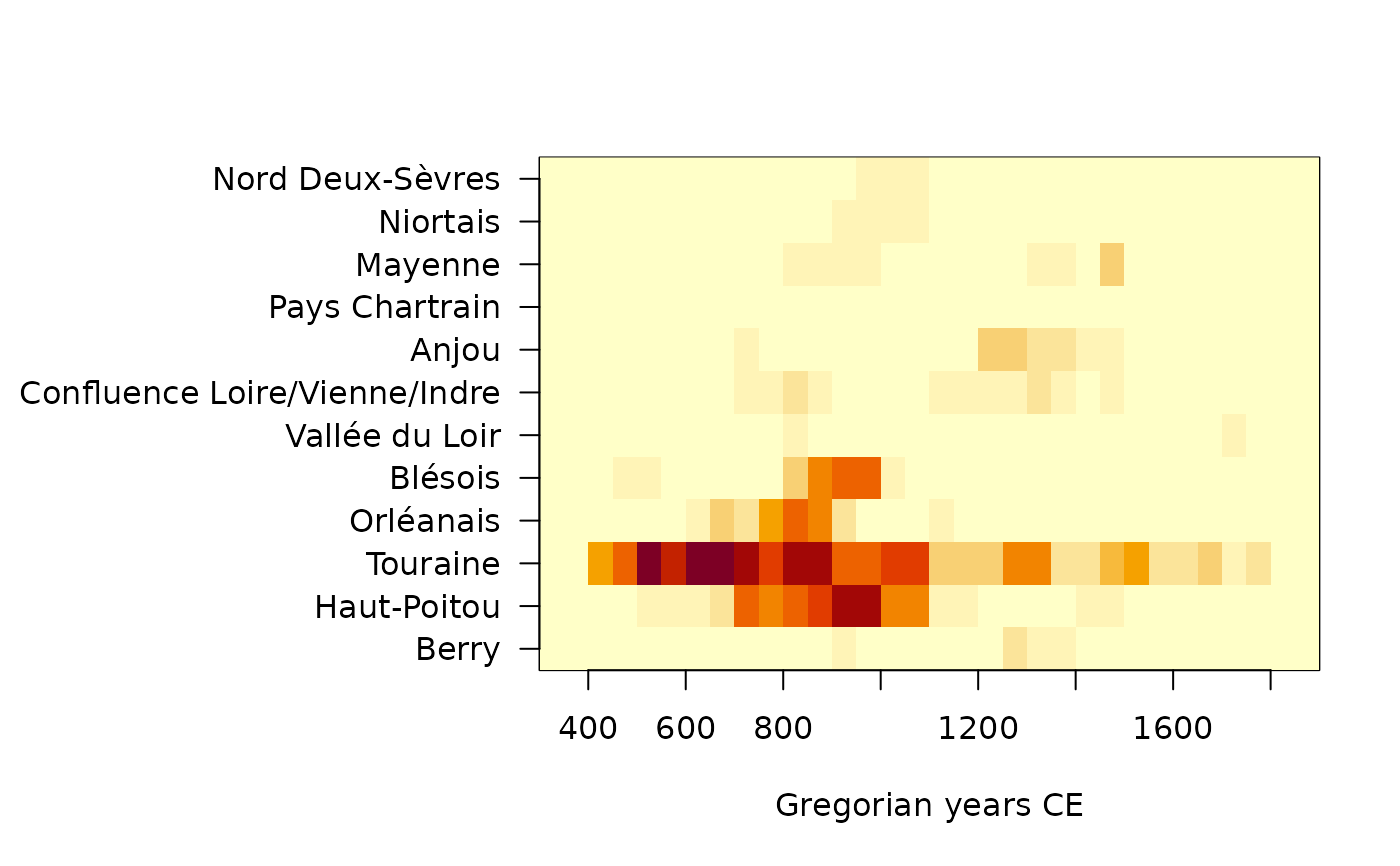
 ## Calculate aoristic sum (weights) by group
aorist_groups <- aoristic(loire_range, step = 50, weight = TRUE,
groups = loire$area)
plot(aorist_groups, flip = TRUE, col = "grey")
## Calculate aoristic sum (weights) by group
aorist_groups <- aoristic(loire_range, step = 50, weight = TRUE,
groups = loire$area)
plot(aorist_groups, flip = TRUE, col = "grey")
 image(aorist_groups)
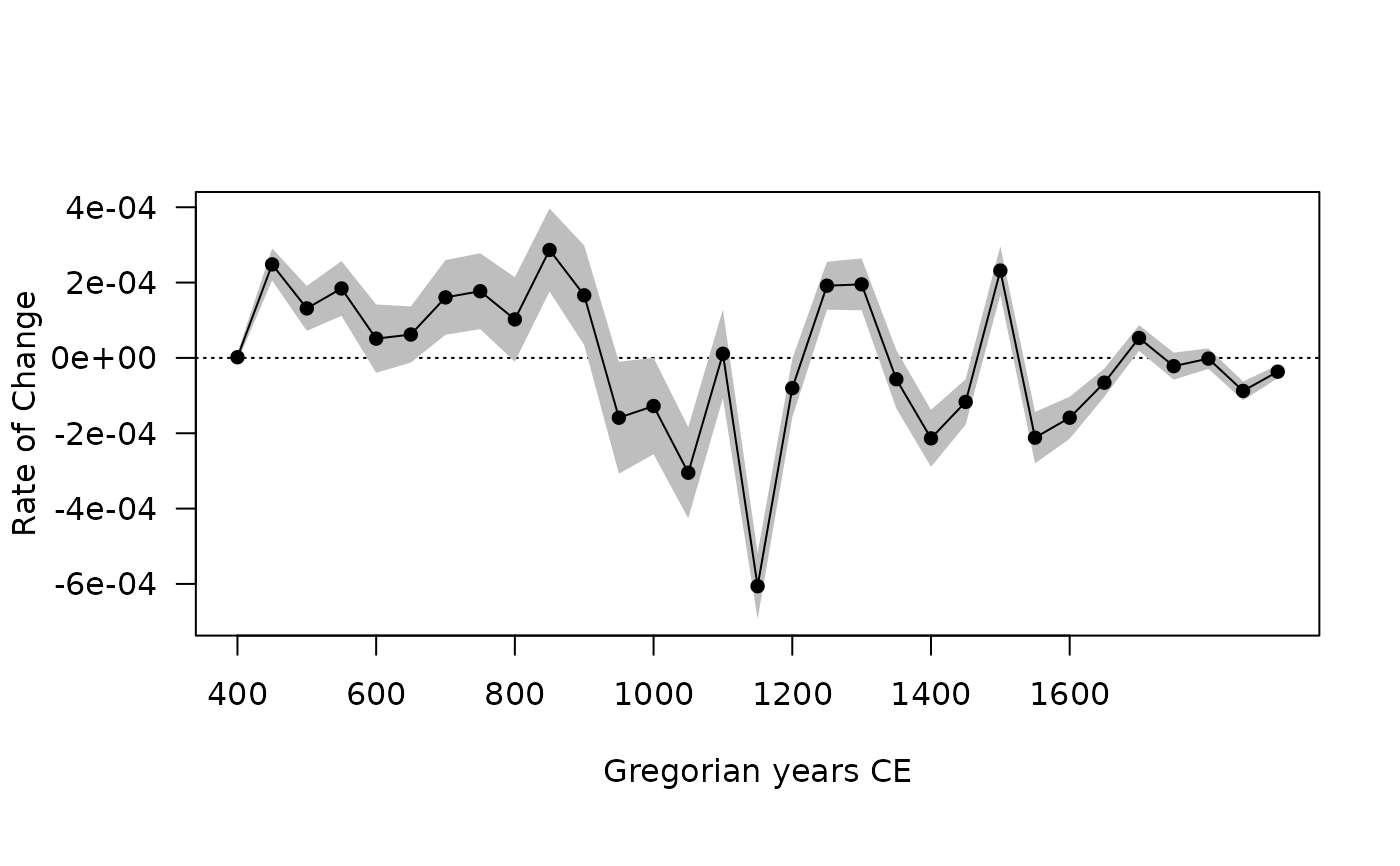
 ## Rate of change
roc_weighted <- roc(aorist_weighted, n = 30)
plot(roc_weighted)
## Rate of change
roc_weighted <- roc(aorist_weighted, n = 30)
plot(roc_weighted)
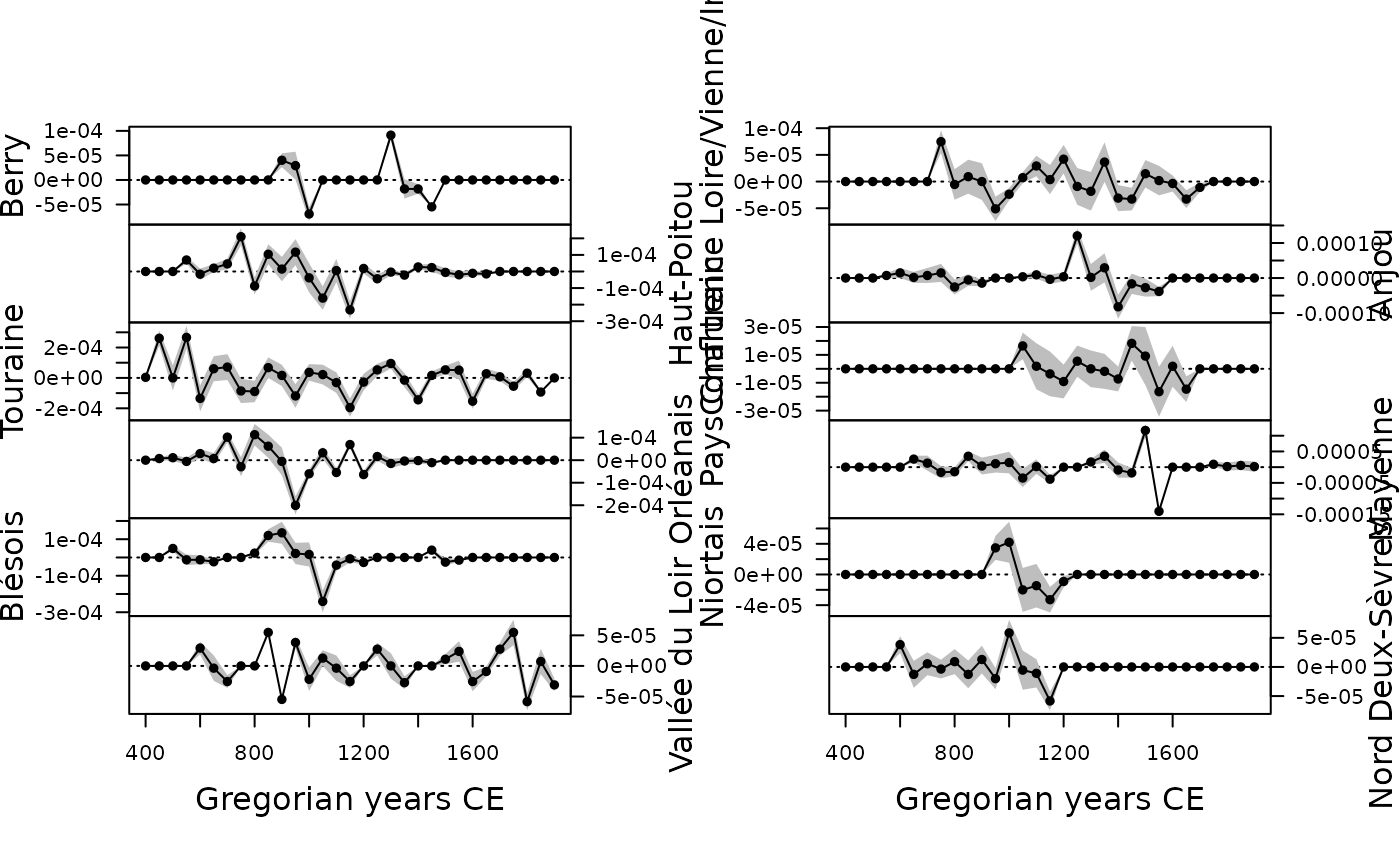
 ## Rate of change by group
roc_groups <- roc(aorist_groups, n = 30)
plot(roc_groups, flip = TRUE)
## Rate of change by group
roc_groups <- roc(aorist_groups, n = 30)
plot(roc_groups, flip = TRUE)