Introduction
Tol (2021) offers carefully chosen schemes, ready for each type of data, with colors that are:
- Distinct for all people, including color-blind readers,
- Distinct from black and white,
- Distinct on screen and paper,
- Matching well together.
All the scales presented in Paul Tol’s technical note (issue 3.2, 2021-08-18) are implemented here, for use with base R graphics, ggplot2 and ggraph.
Qualitative data
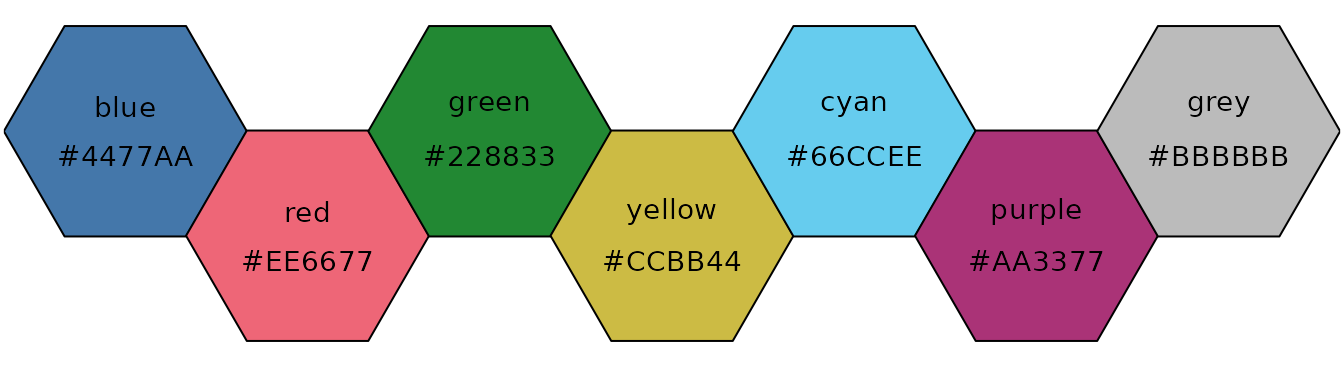
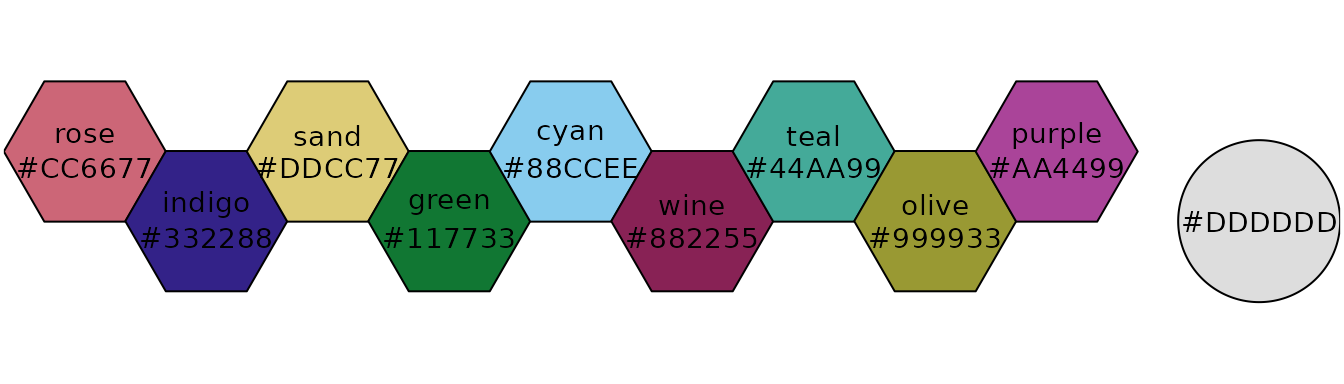
According to Paul Tol’s technical note, the bright, contrast, vibrant and muted color schemes are color-blind safe.
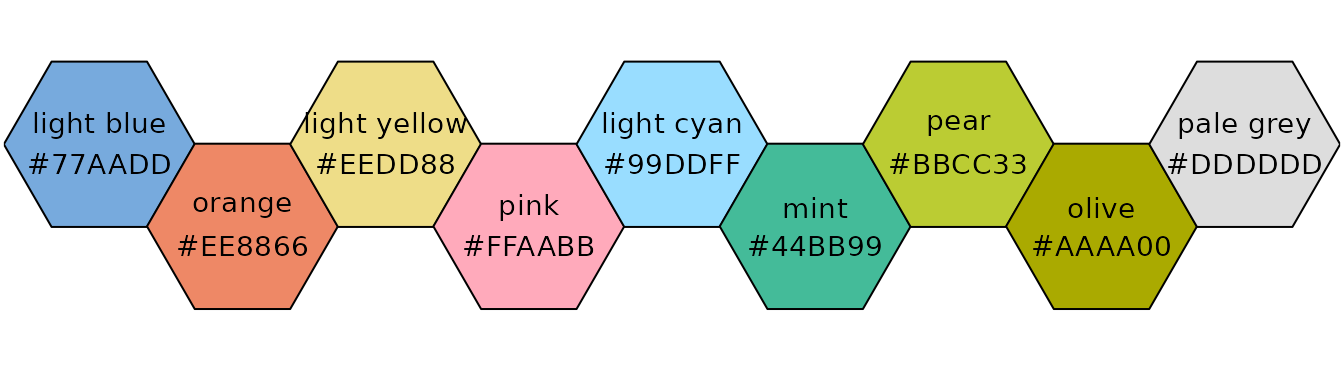
The light color scheme is reasonably distinct for both normal or color-blind vision and is intended to fill labelled cells.
The pale and dark schemes are not very distinct in either normal or color-blind vision and should be used as a text background or to highlight a cell in a table.
The qualitative color schemes must be used as given (no interpolation): colors are picked up to the maximum number of supported values. Refer to the original document for details about the recommended uses (see references).
| Scheme | Max. colors |
|---|---|
bright |
7 |
high contrast |
3 |
vibrant |
7 |
muted |
9 |
medium contrast |
3 |
pale |
6 |
dark |
6 |
light |
9 |
high contrast
highcontrast <- color("high contrast")
plot_scheme(highcontrast(3), colours = TRUE, names = TRUE, size = 0.9)
vibrant
vibrant <- color("vibrant")
plot_scheme(vibrant(7), colours = TRUE, names = TRUE, size = 0.9)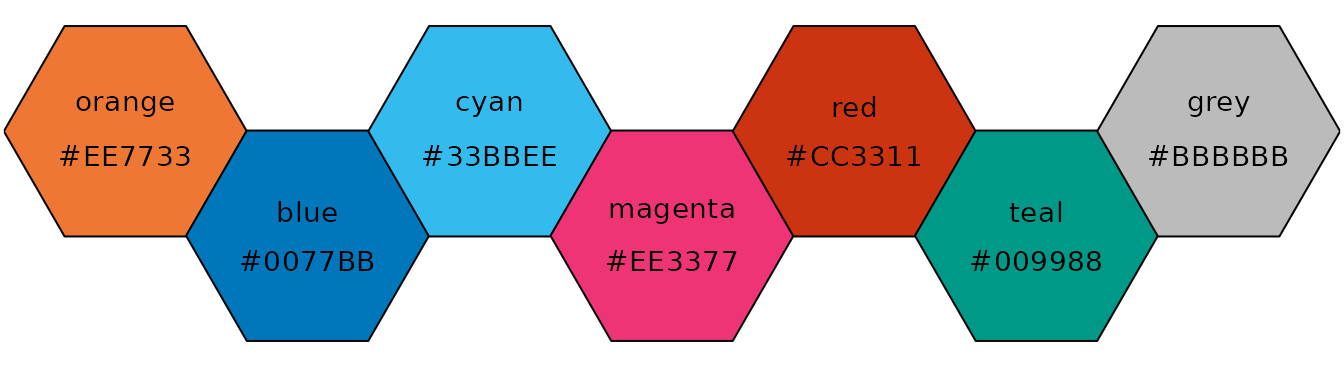
medium contrast
mediumcontrast <- color("medium contrast")
plot_scheme(mediumcontrast(6), colours = TRUE, names = TRUE, size = 0.9)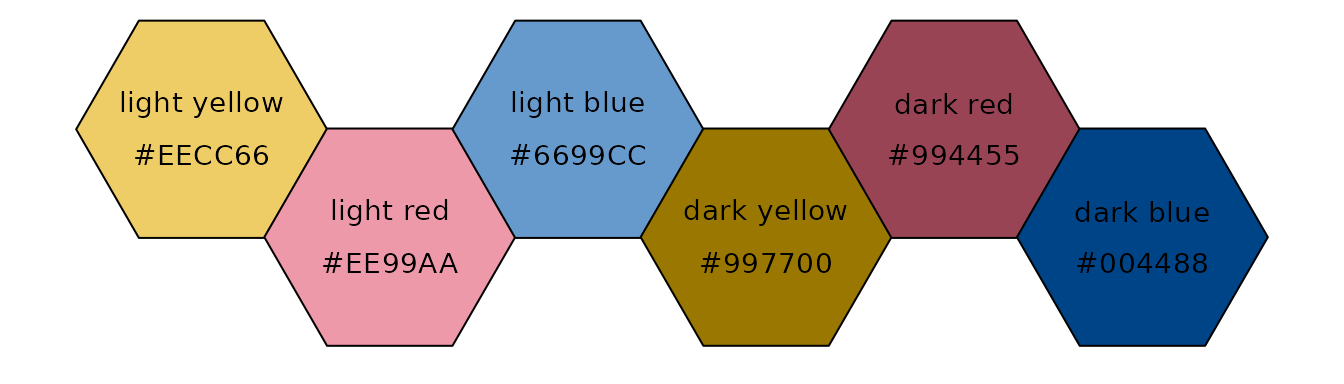
pale and dark
pale <- color("pale")
plot_scheme(pale(6), colours = TRUE, names = TRUE, size = 0.9)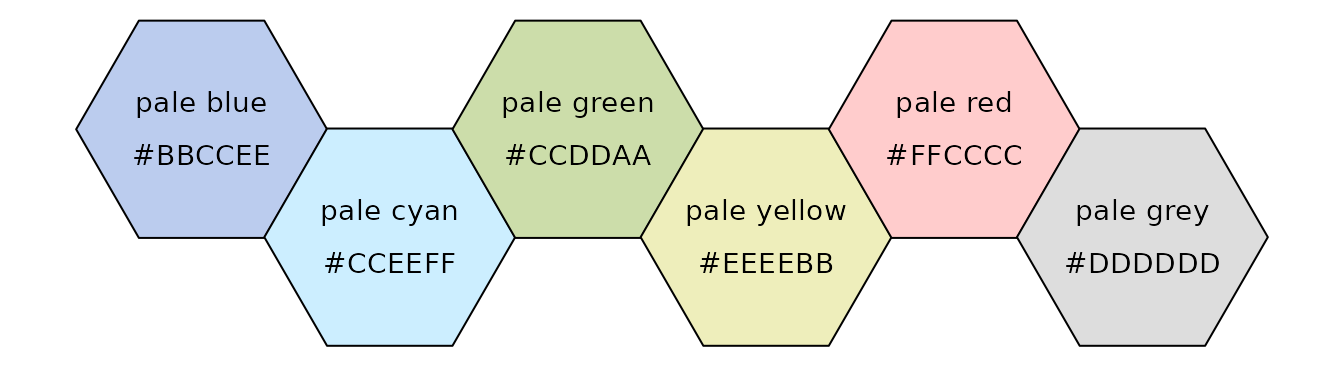
dark <- color("dark")
plot_scheme(dark(6), colours = TRUE, names = TRUE, size = 0.9)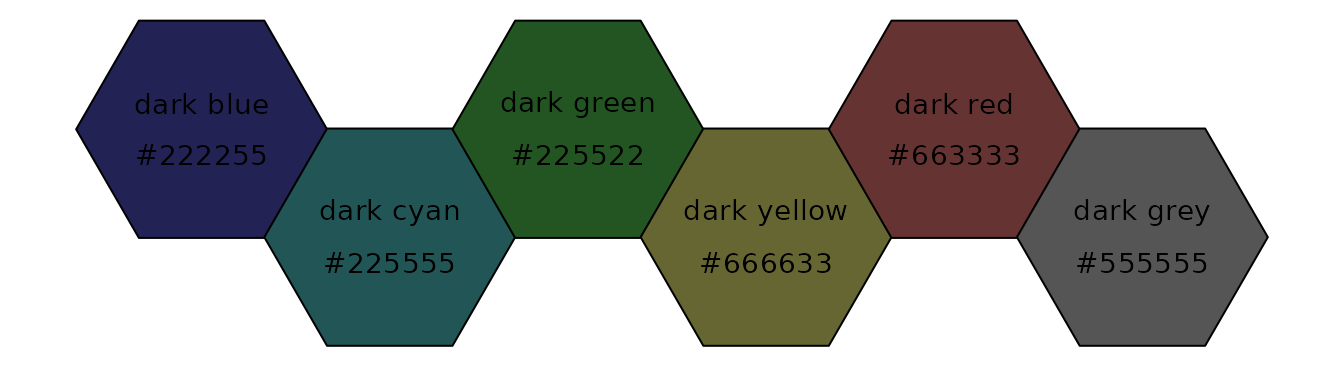
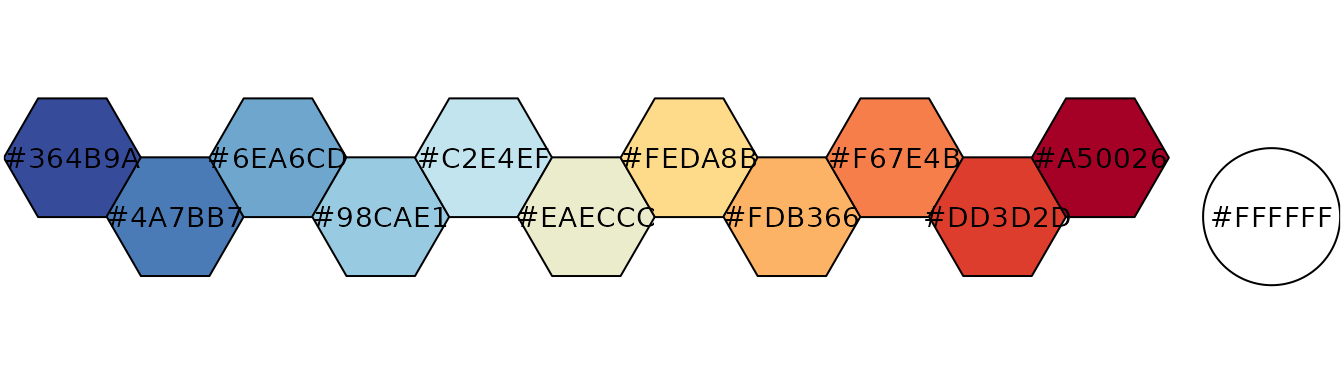
Diverging data
If more colors than defined are needed from a given scheme, the color coordinates are linearly interpolated to provide a continuous version of the scheme.
| Scheme | Num. of colors | Bad data |
|---|---|---|
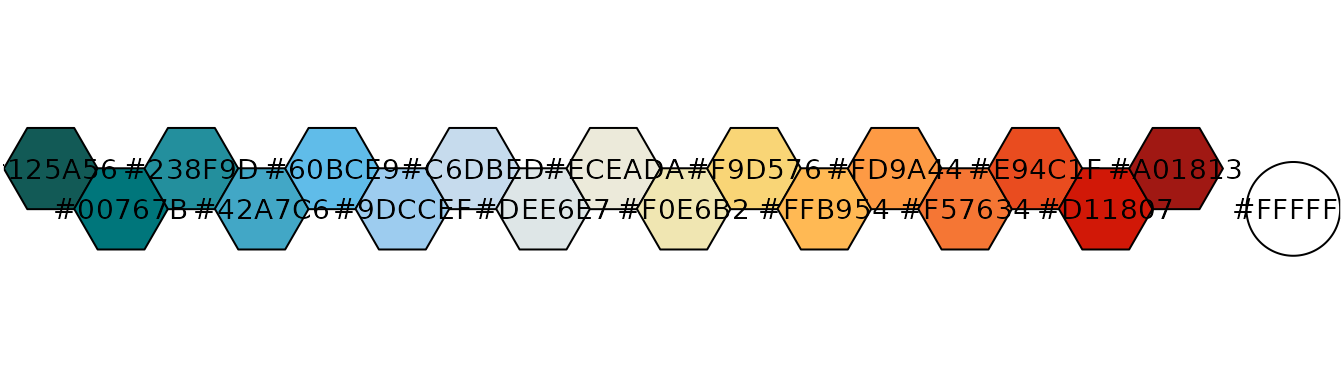
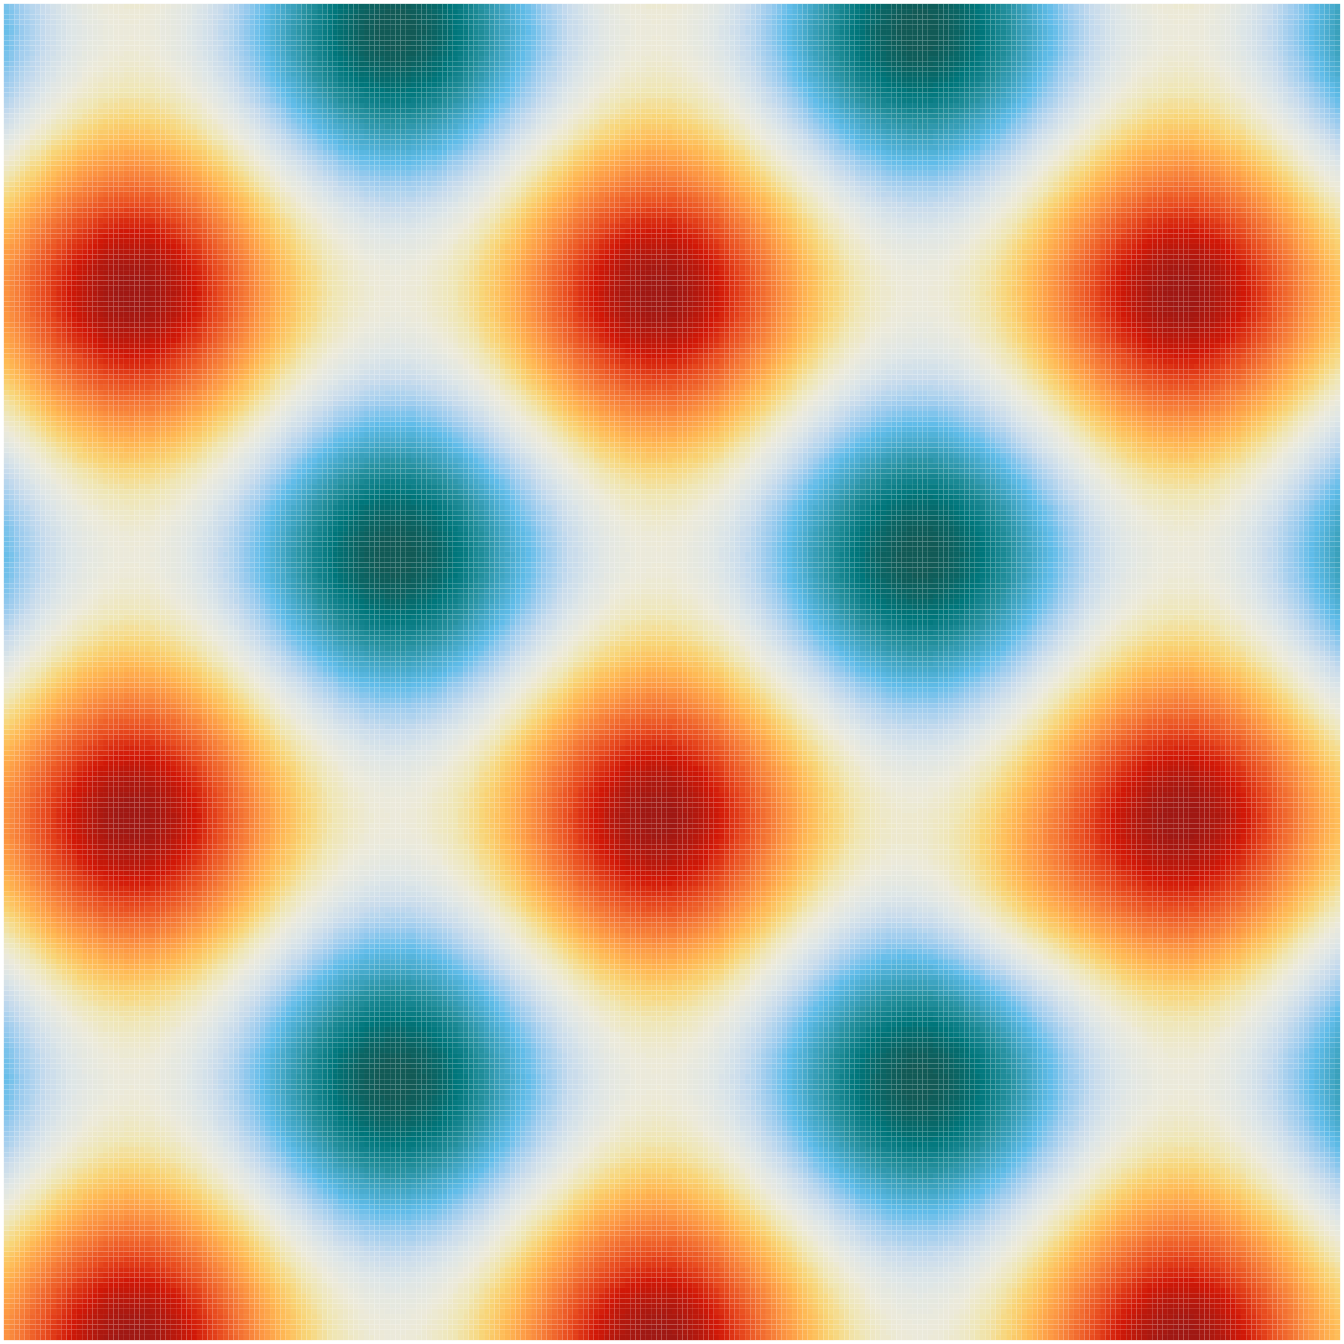
sunset |
11 | #FFFFFF |
nightfall |
17 | #FFFFFF |
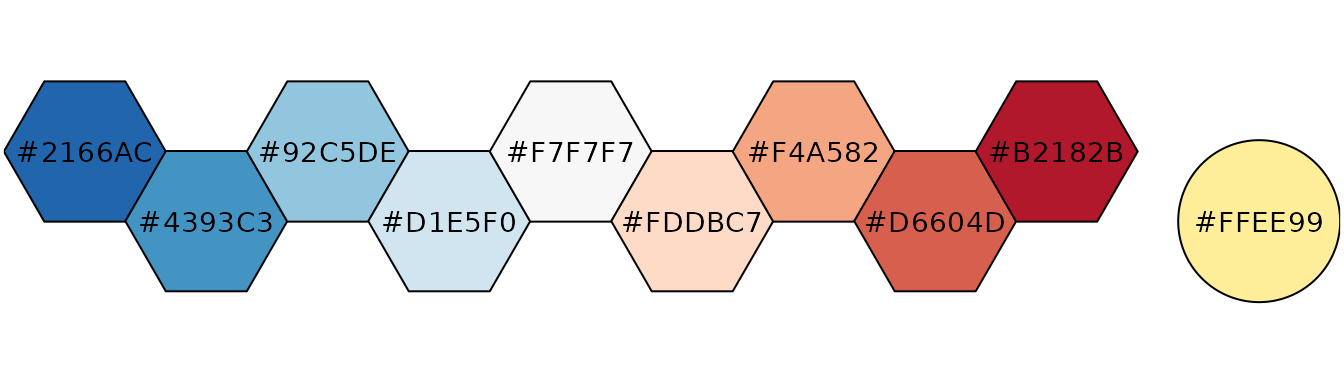
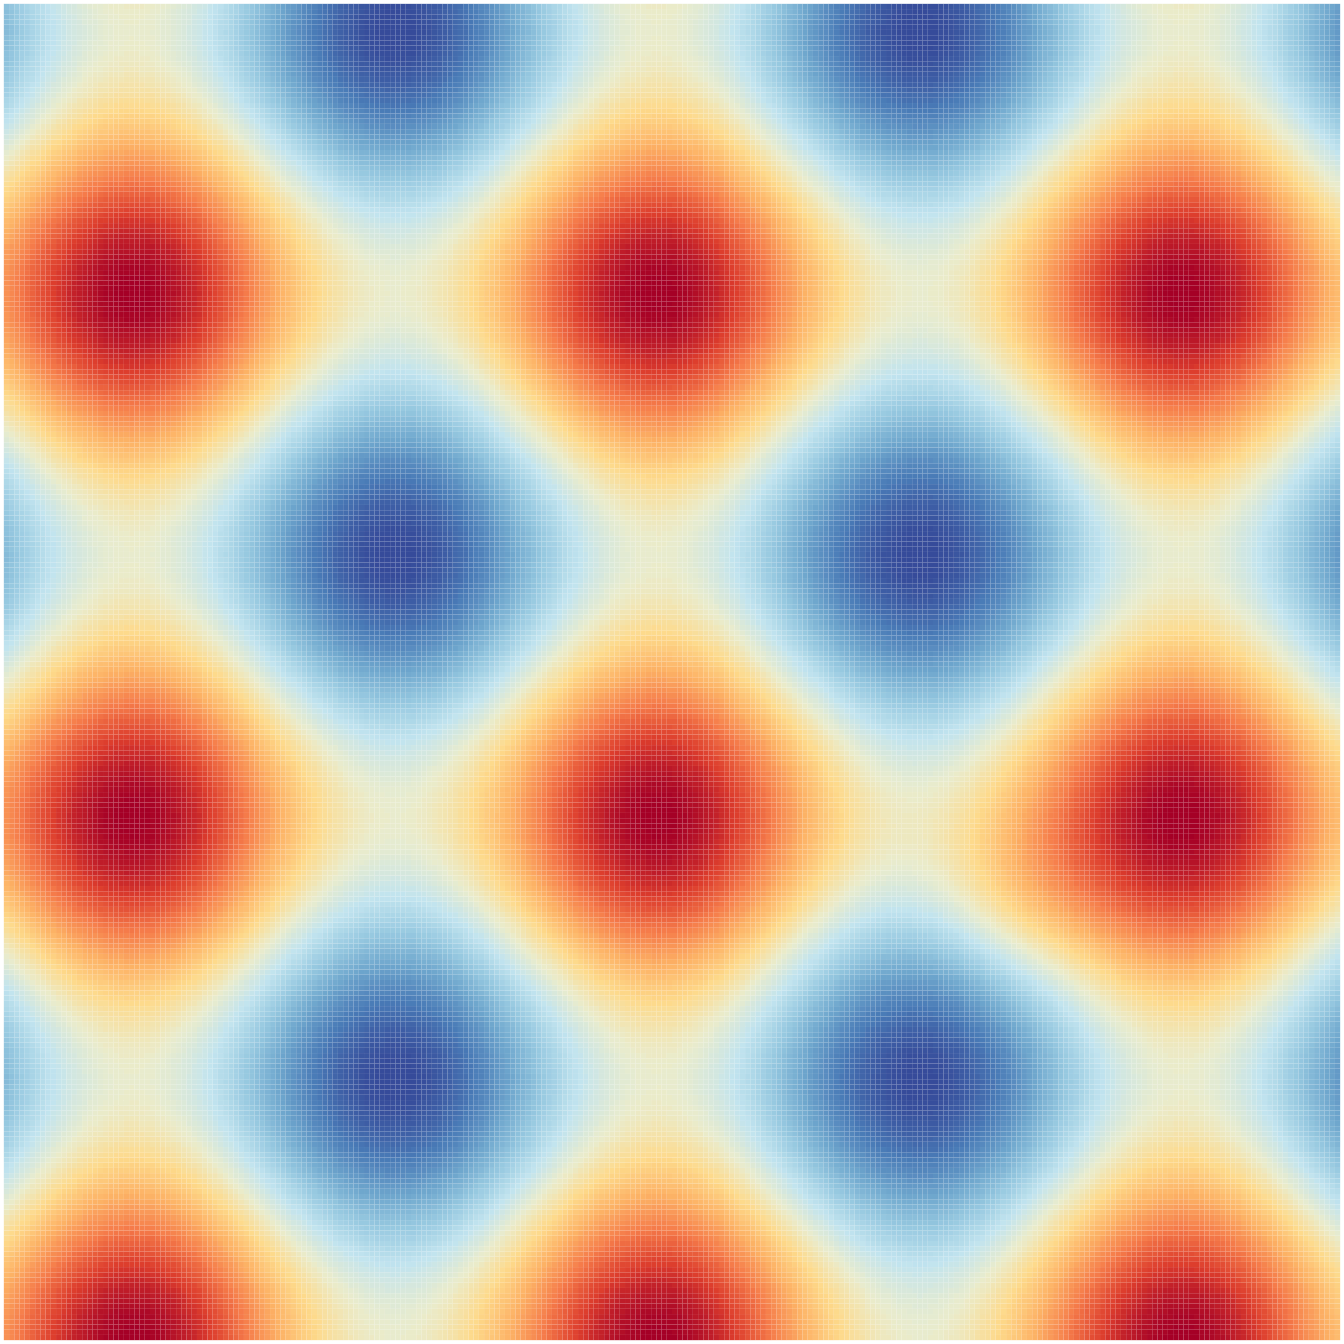
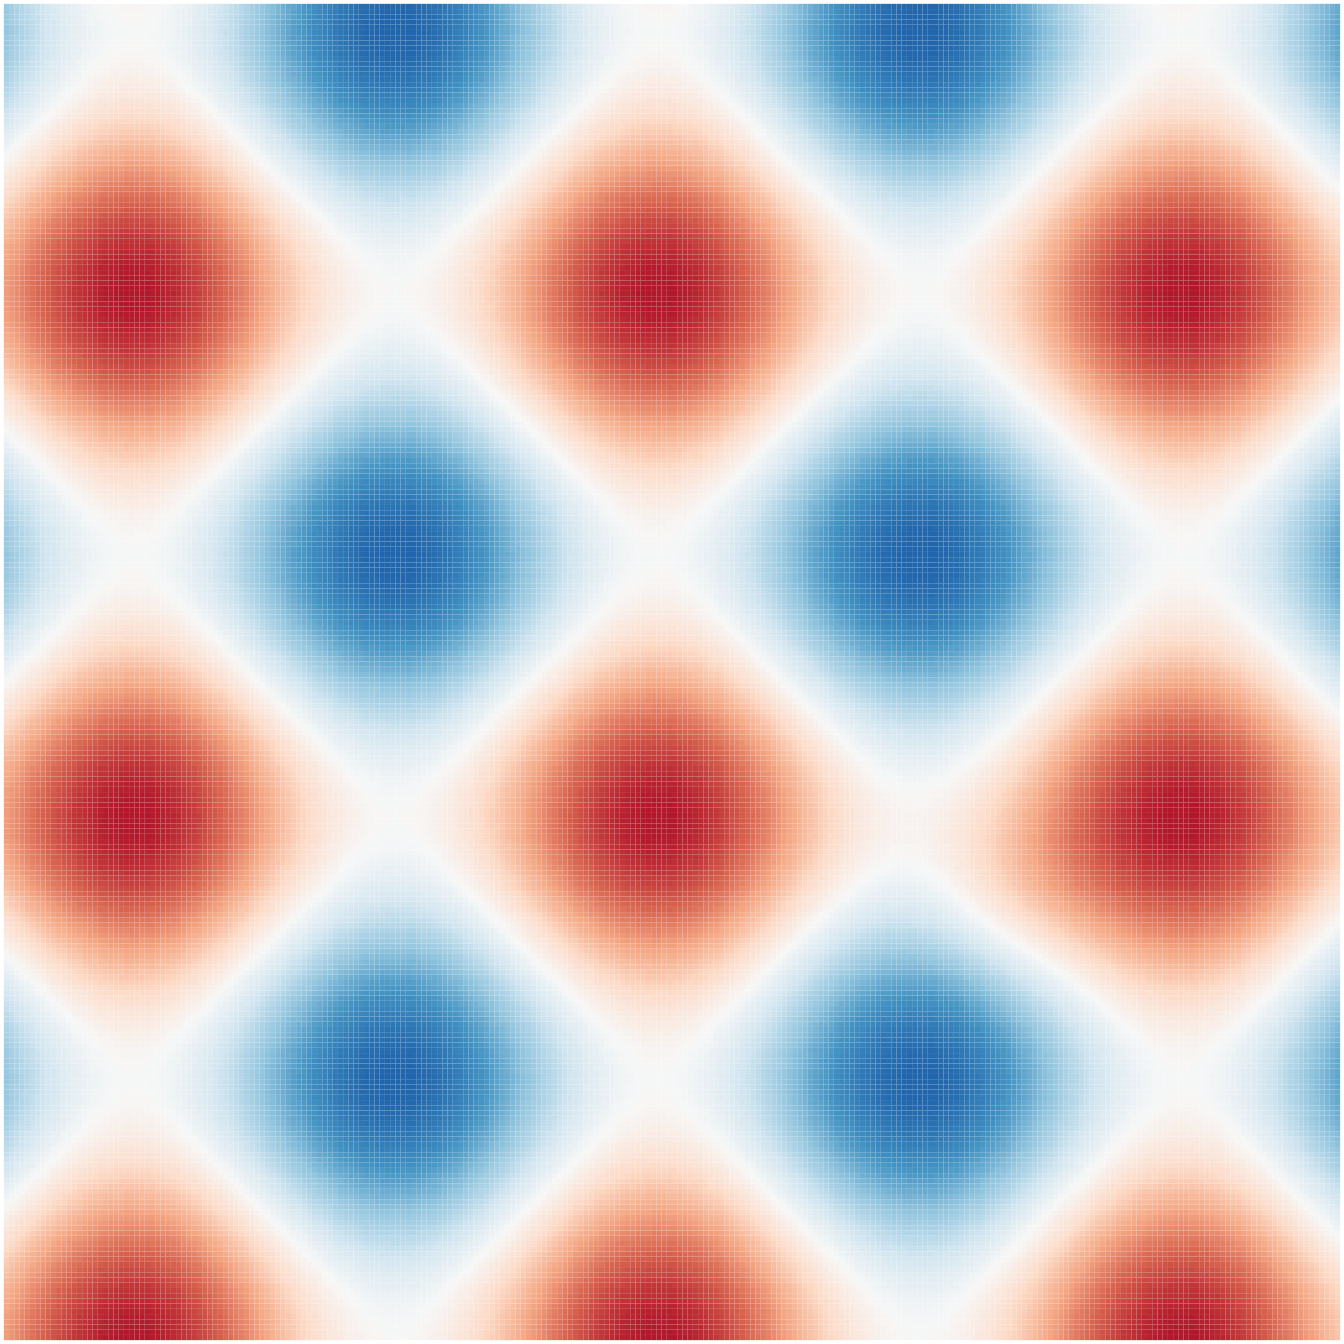
BuRd |
9 | #FFEE99 |
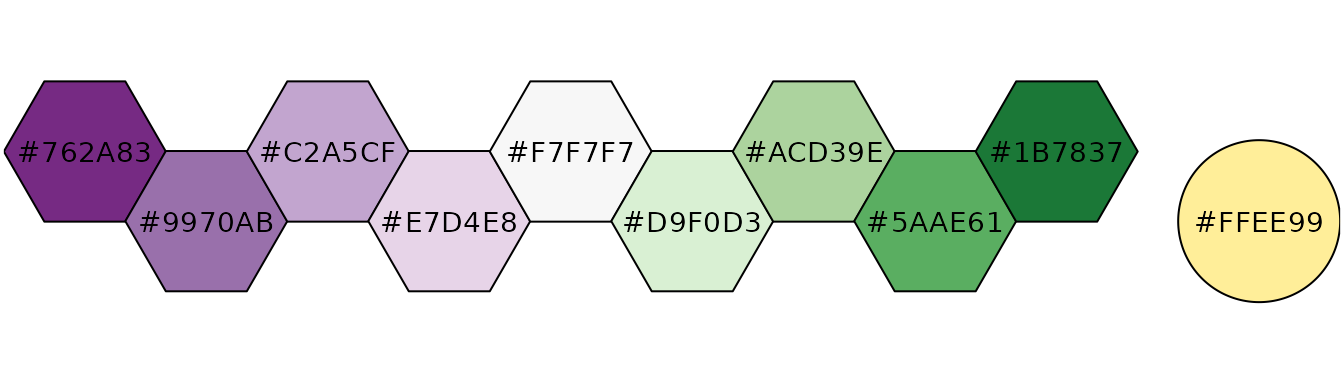
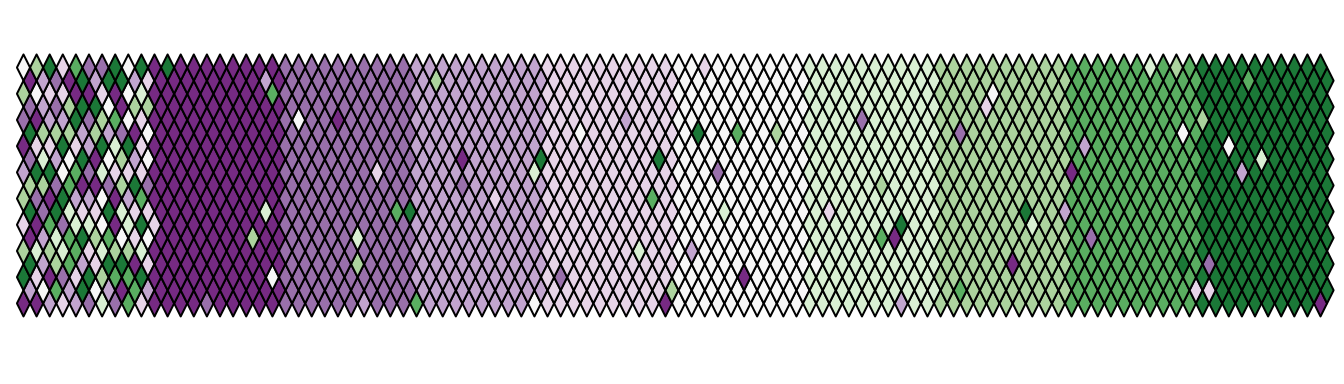
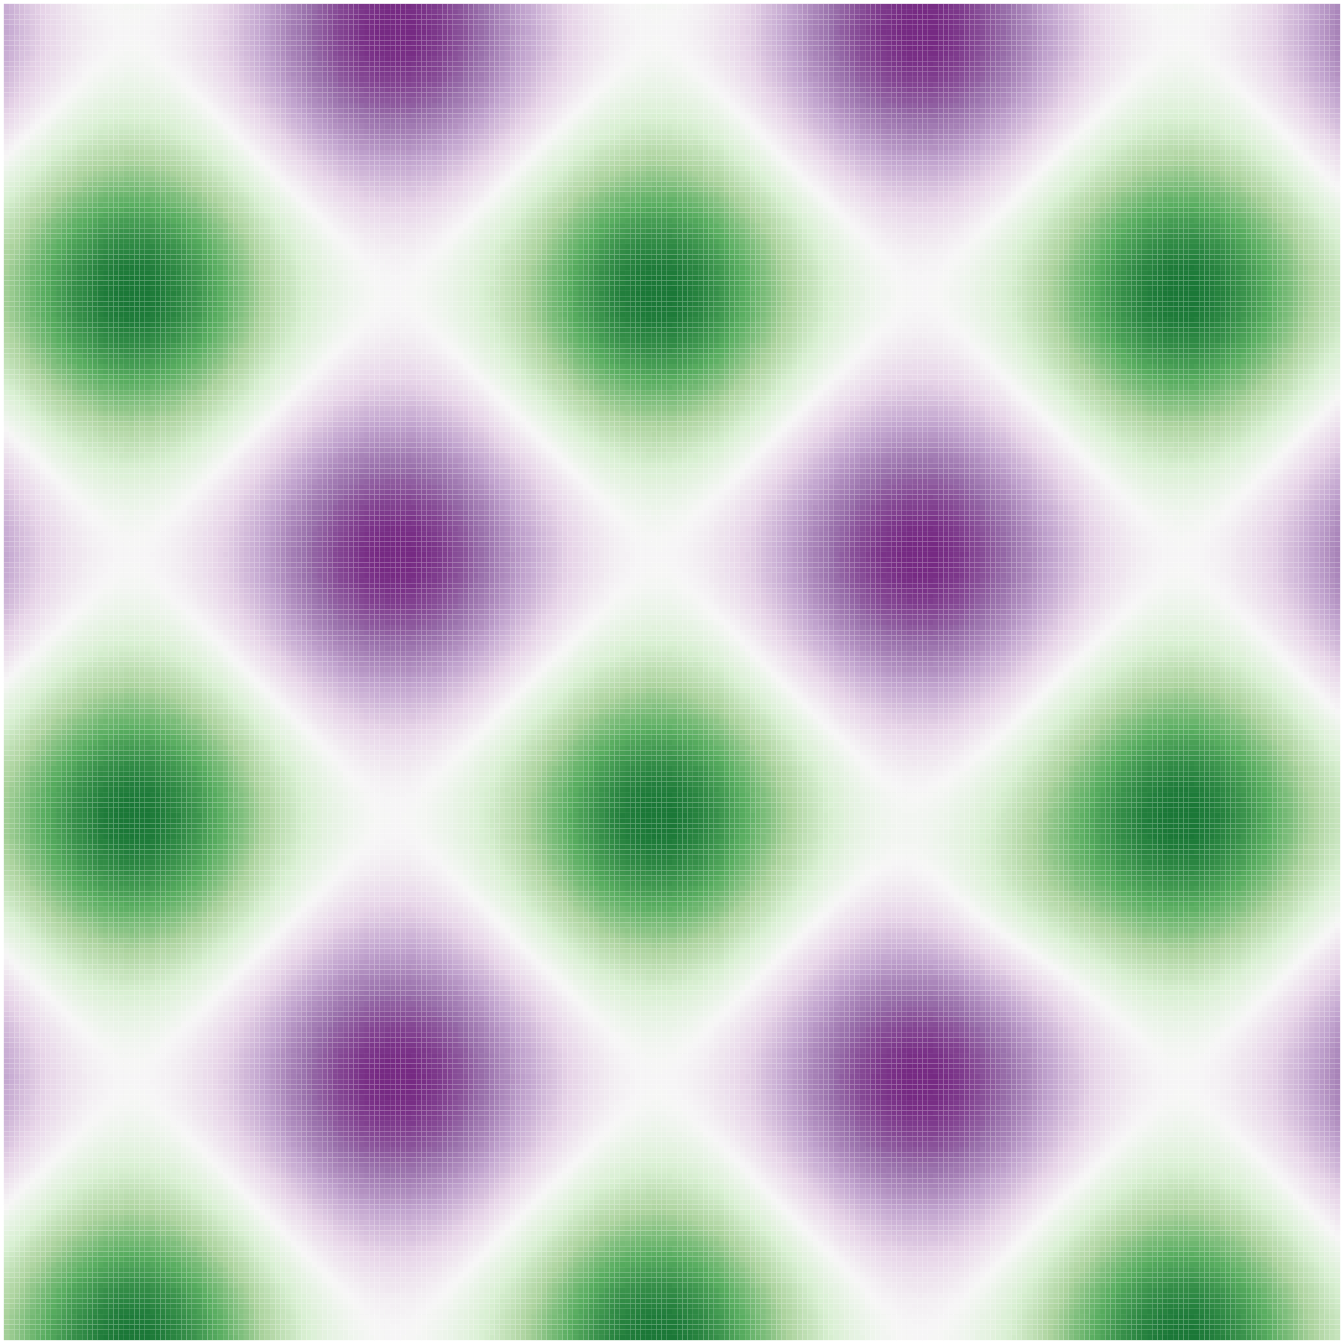
PRGn |
9 | #FFEE99 |
Sequential data
If more colors than defined are needed from a given scheme, the color coordinates are linearly interpolated to provide a continuous version of the scheme, with the exception of the discrete rainbow scheme (see below).
| Scheme | Num. of colors | Bad data |
|---|---|---|
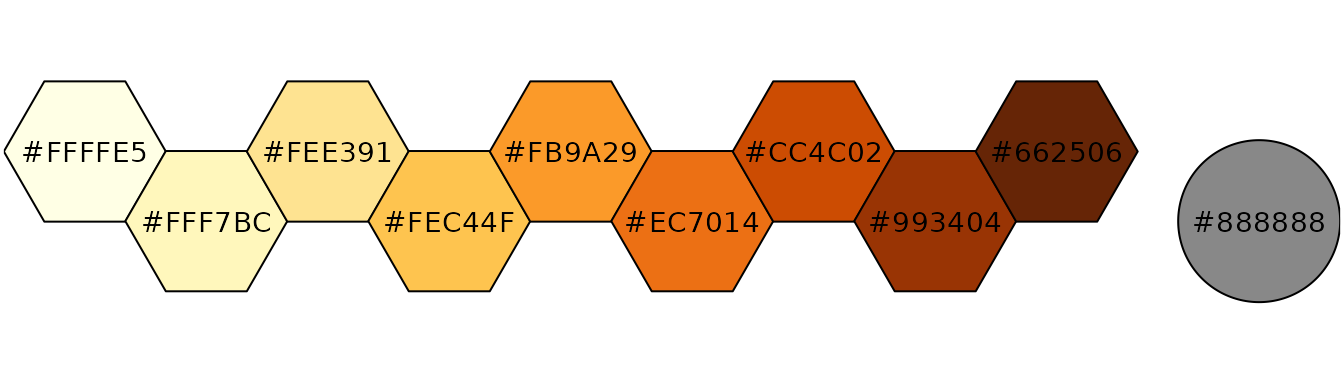
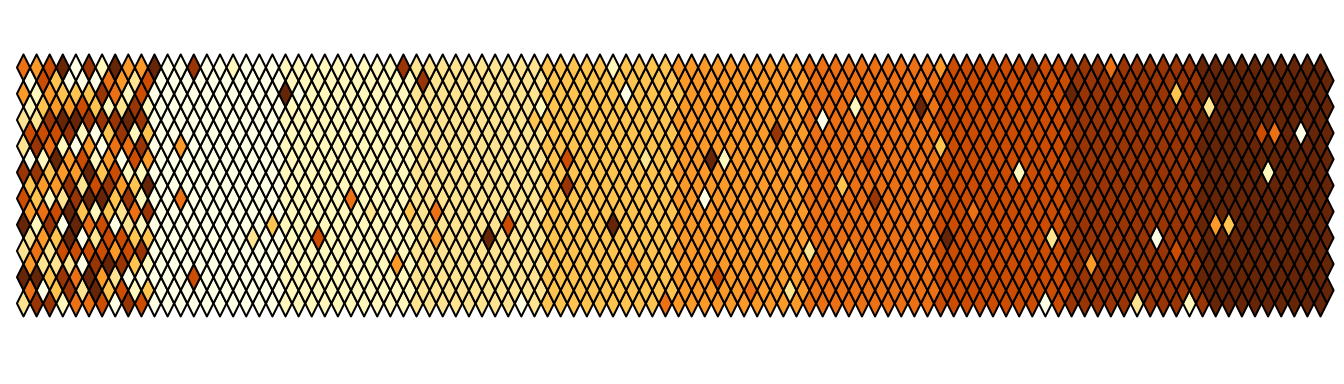
YlOrBr |
9 | #888888 |
iridescent |
23 | #999999 |
incandescent |
11 | #888888 |
discrete rainbow |
23 | #777777 |
smooth rainbow |
34 | #666666 |
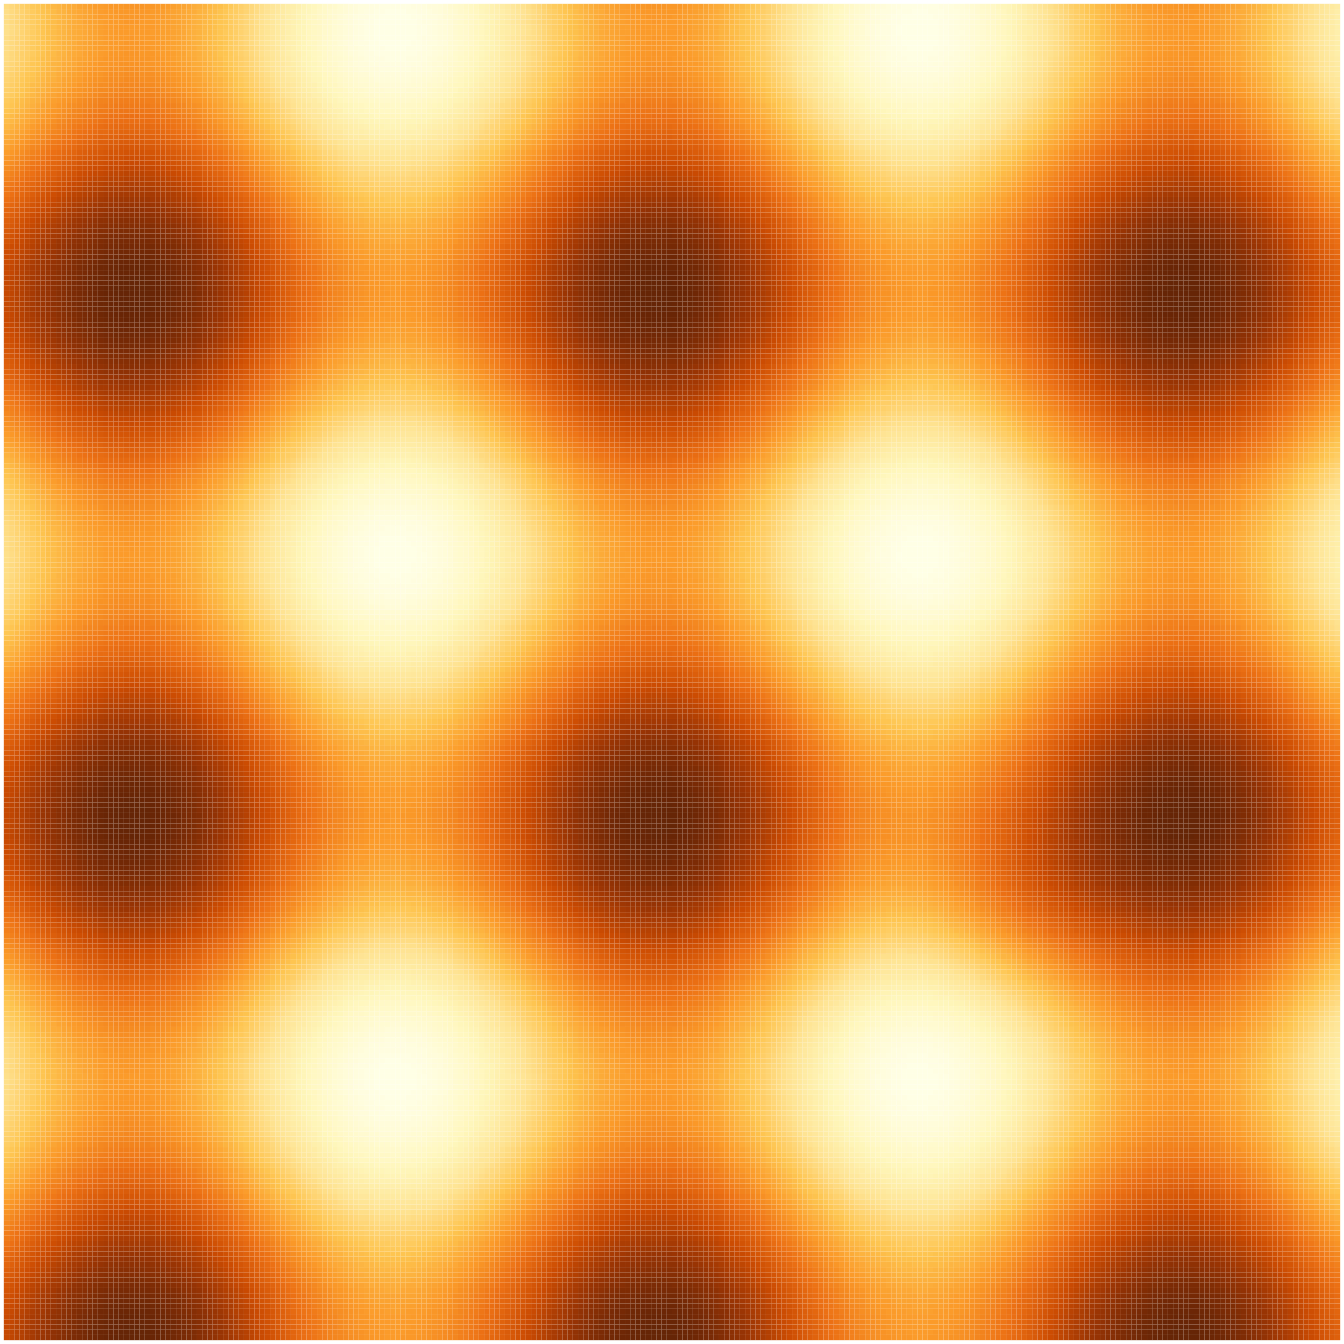
iridescent
iridescent <- color("iridescent")
plot_scheme(iridescent(23), colours = TRUE, size = 0.5)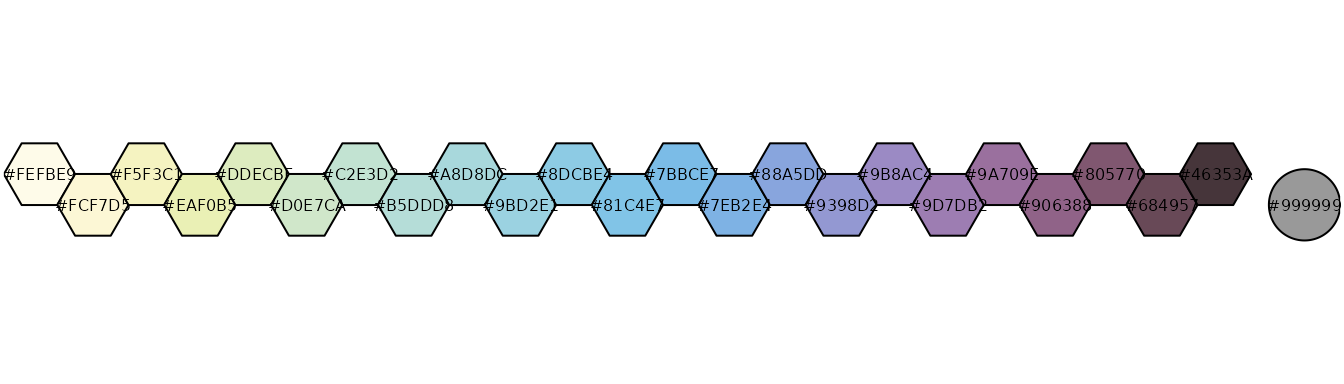
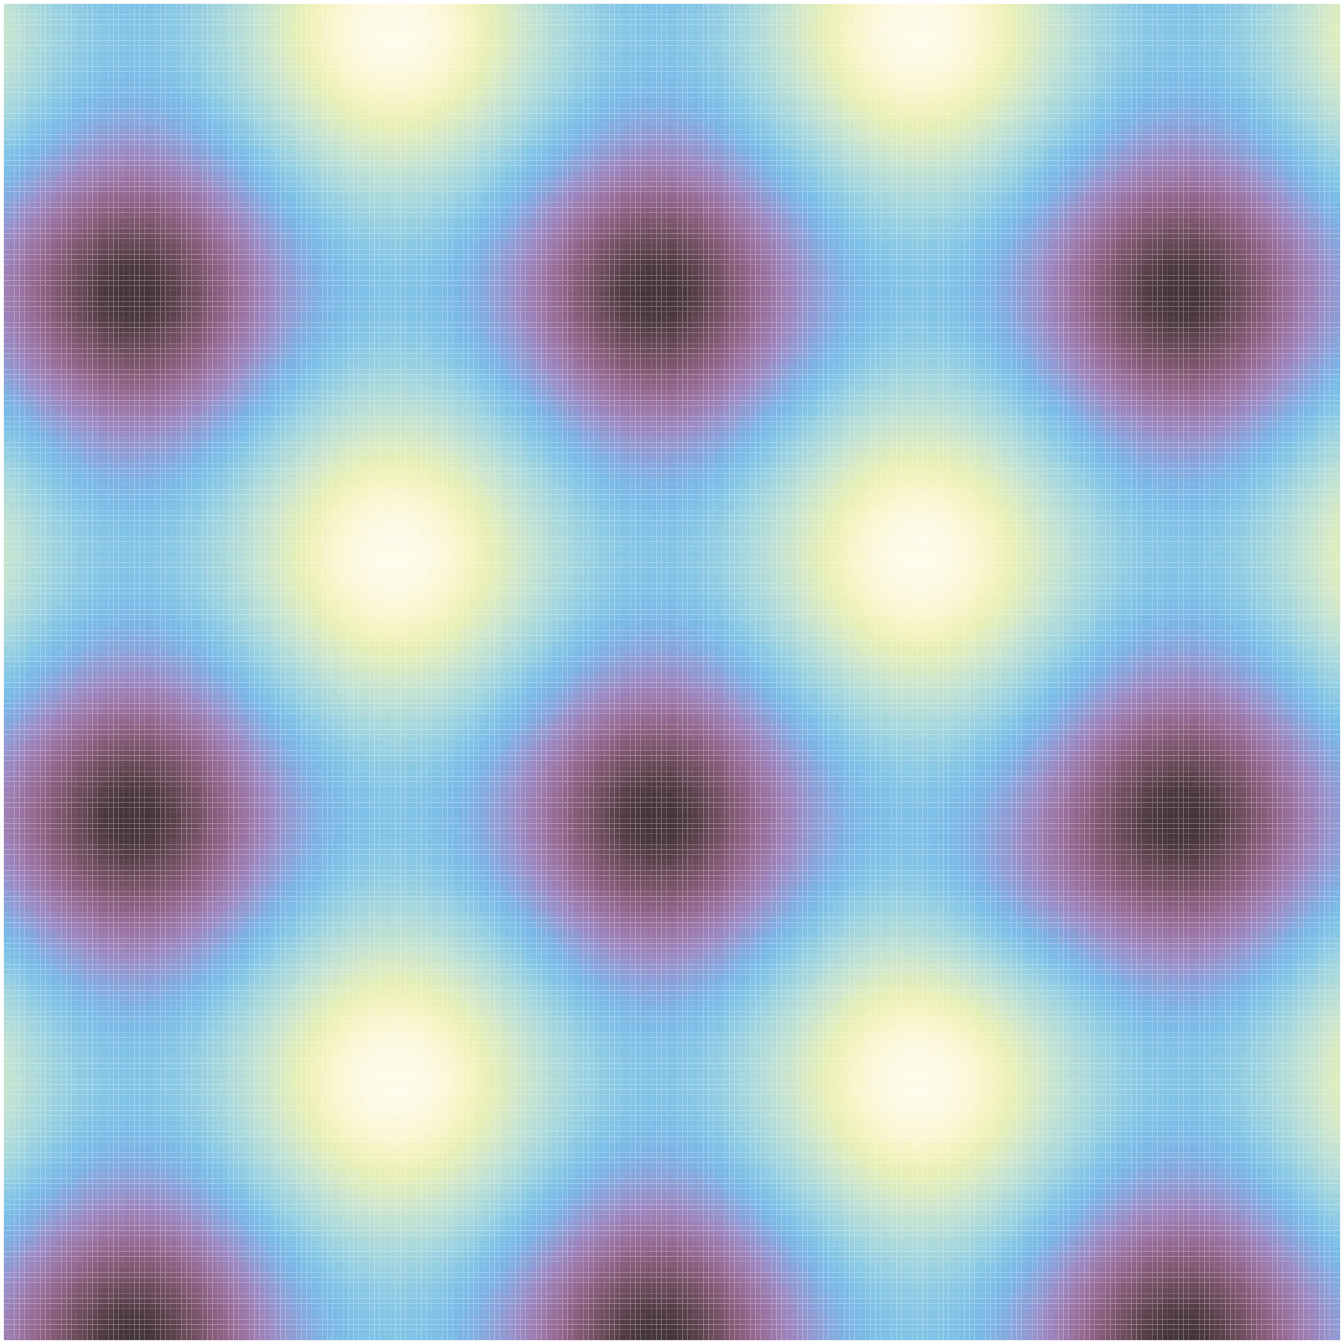
incandescent
incandescent <- color("incandescent")
plot_scheme(incandescent(11), colours = TRUE, size = 0.5)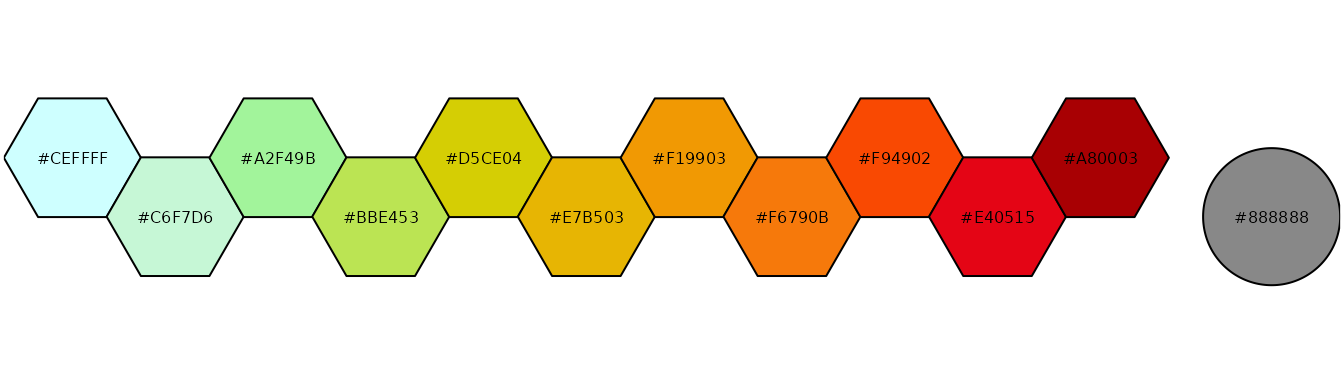
rainbow
As a general rule, ordered data should not be represented using a rainbow scheme. There are three main arguments against such use (Tol 2021):
- The spectral order of visible light carries no inherent magnitude message.
- Some bands of almost constant hue with sharp transitions between them, can be perceived as jumps in the data.
- Color-blind people have difficulty distinguishing some colors of the rainbow.
If such use cannot be avoided, Paul Tol’s technical note provides two color schemes that are reasonably clear in color-blind vision. To remain color-blind safe, these two schemes must comply with the following conditions:
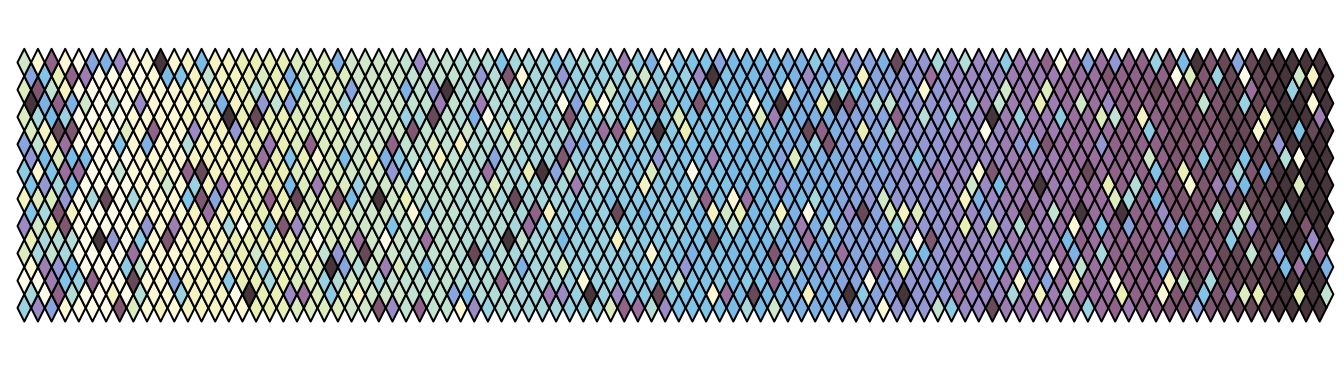
- discrete rainbow
- This scheme must not be interpolated.
- smooth rainbow
- This scheme does not have to be used over the full range. Tol (2021) suggests starting at purple.
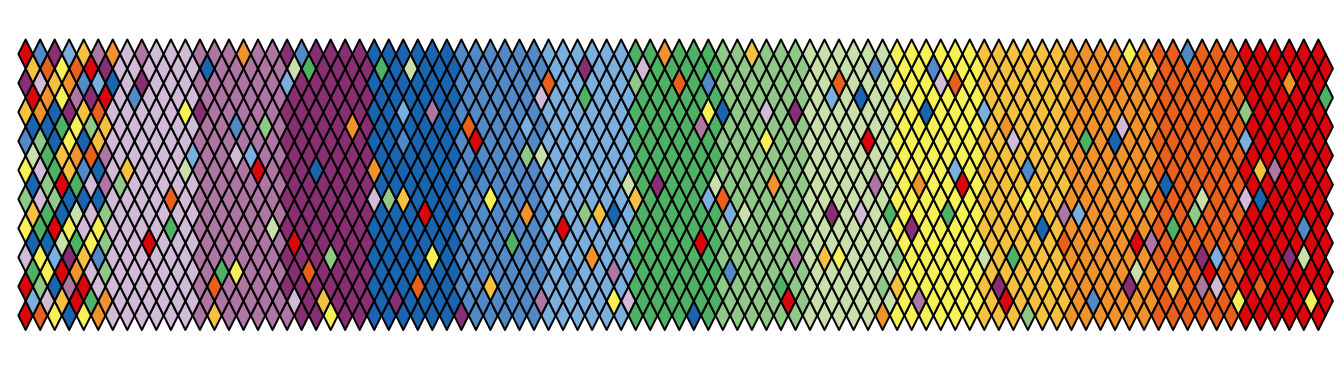
discrete_rainbow <- color("discrete rainbow")
plot_scheme(discrete_rainbow(14), colours = TRUE, size = 0.7)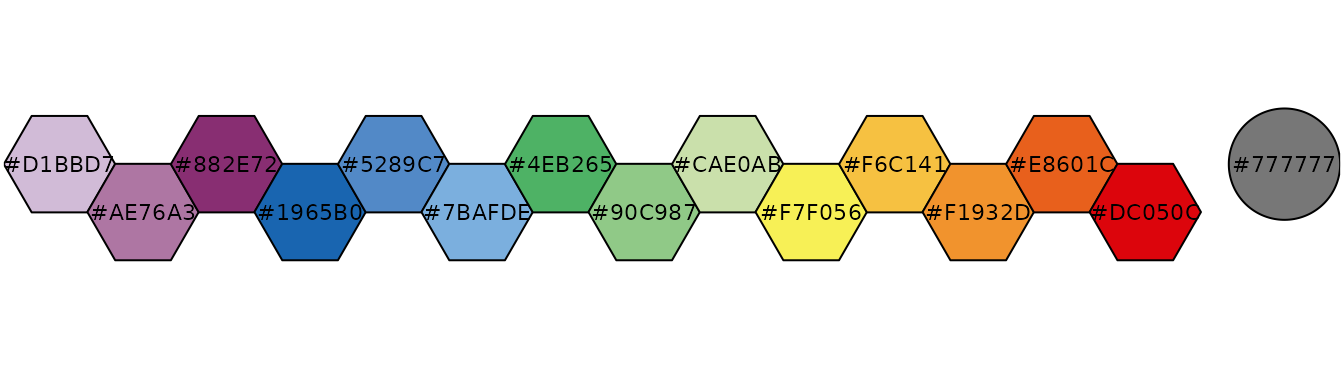
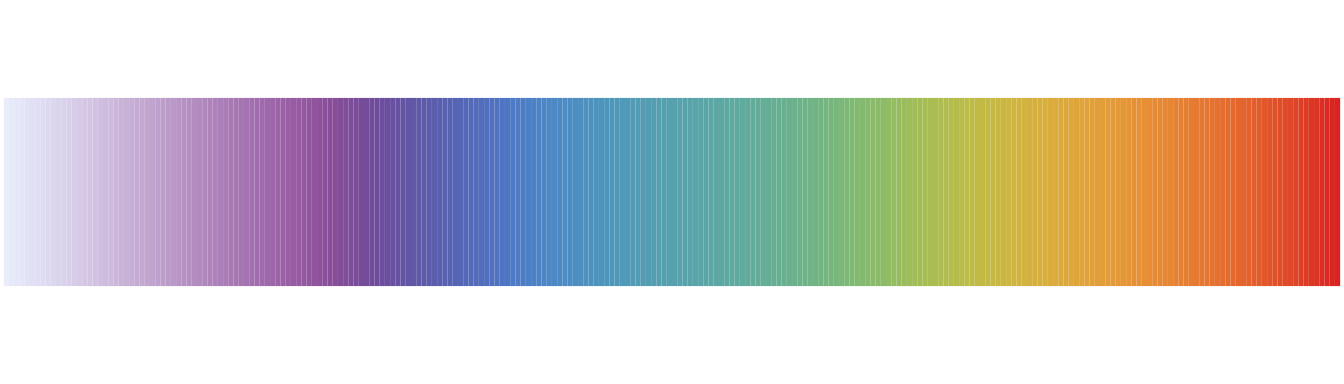
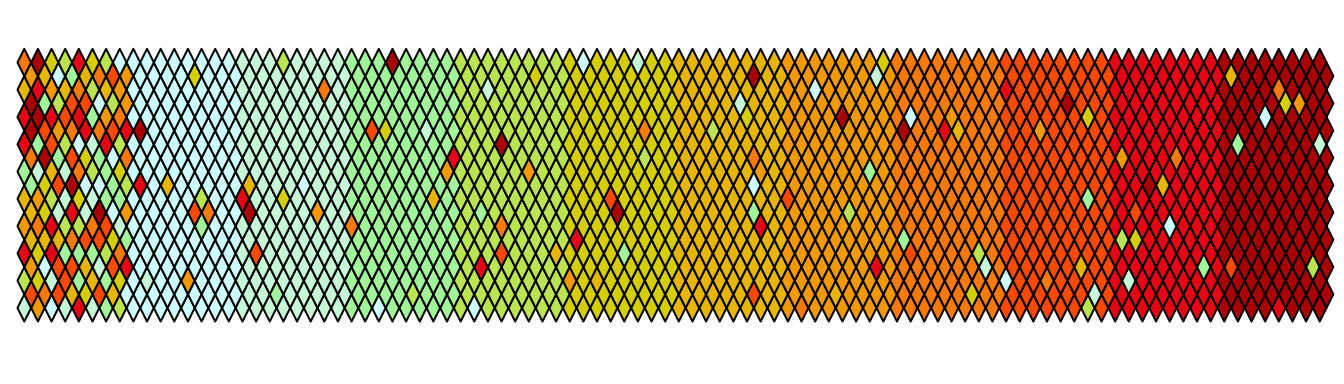
When using the smooth rainbow scheme:
- Start off-white instead of purple if the lowest data value occurs often;
- End at red instead of brown the highest data value occurs often.
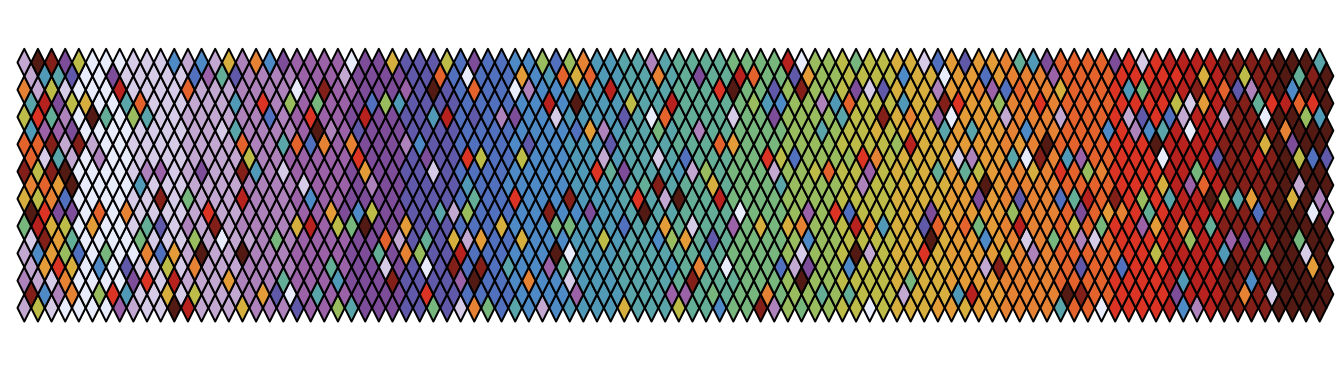
smooth_rainbow <- color("smooth rainbow")

## Start at purple instead of off-white
plot(smooth_rainbow(256, range = c(0.25, 1)))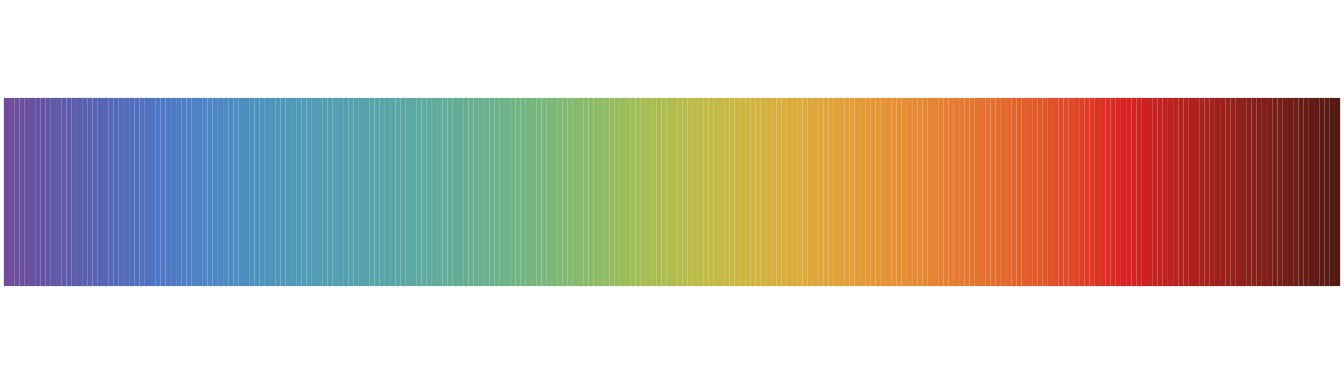
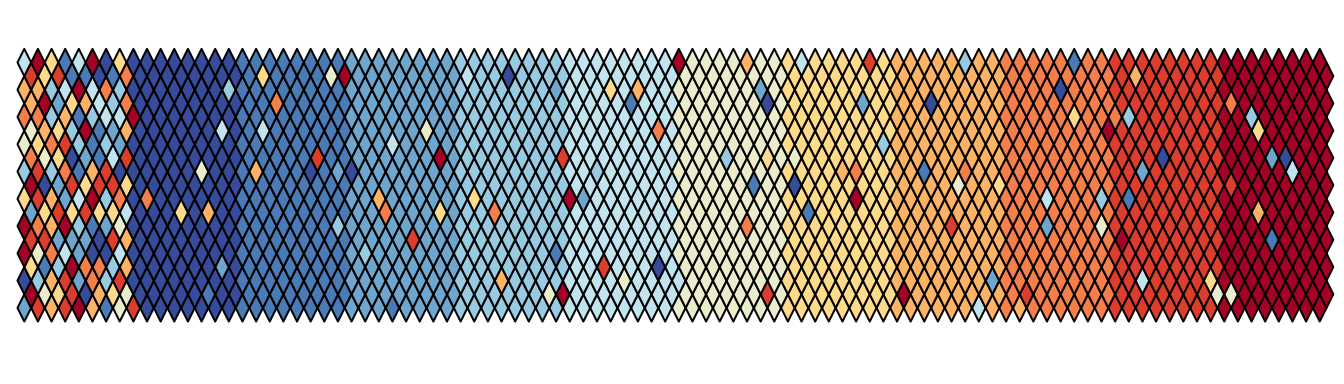
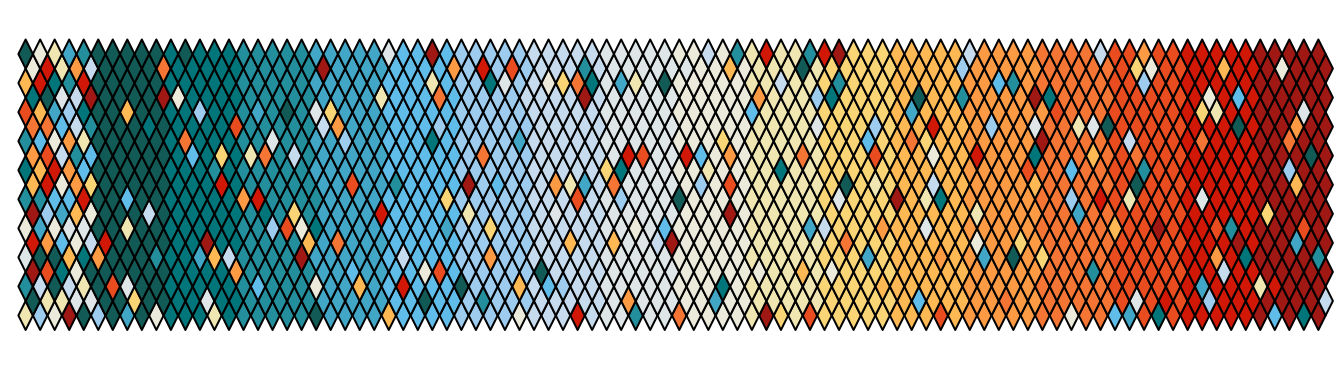
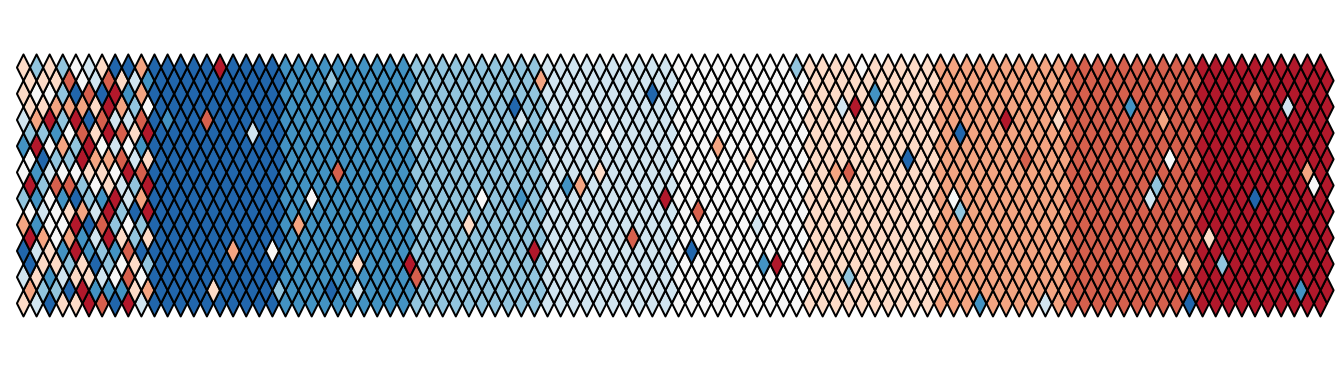
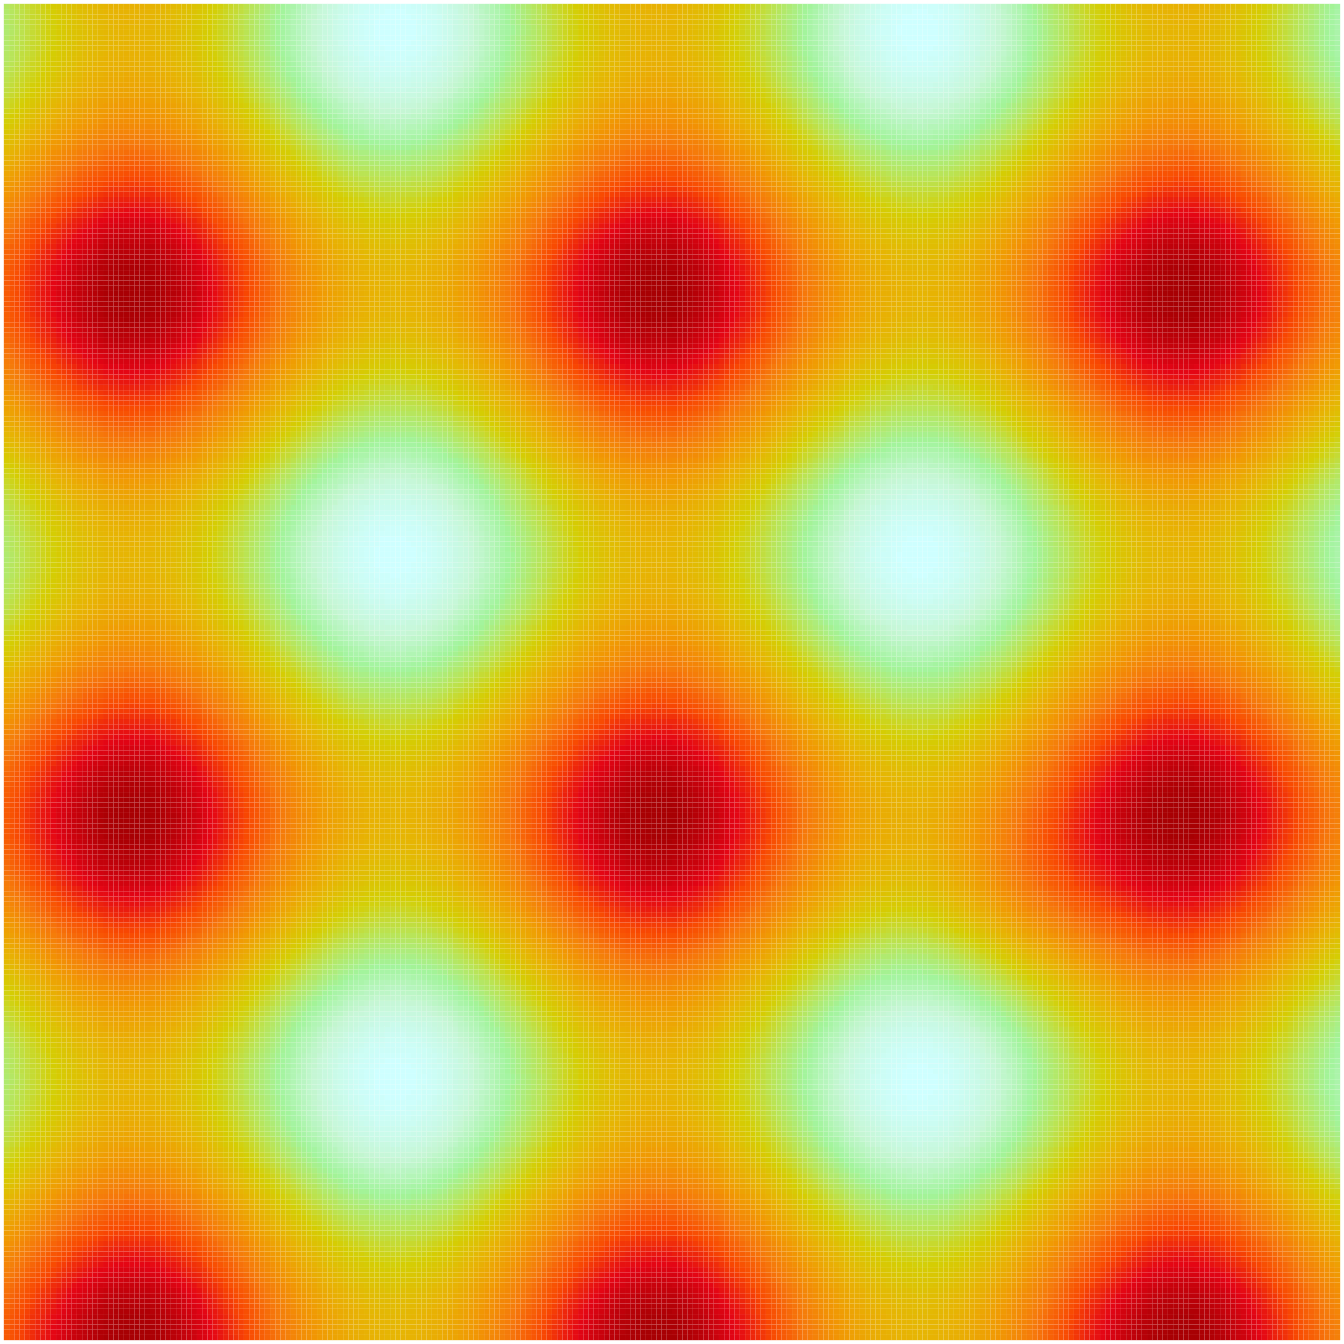
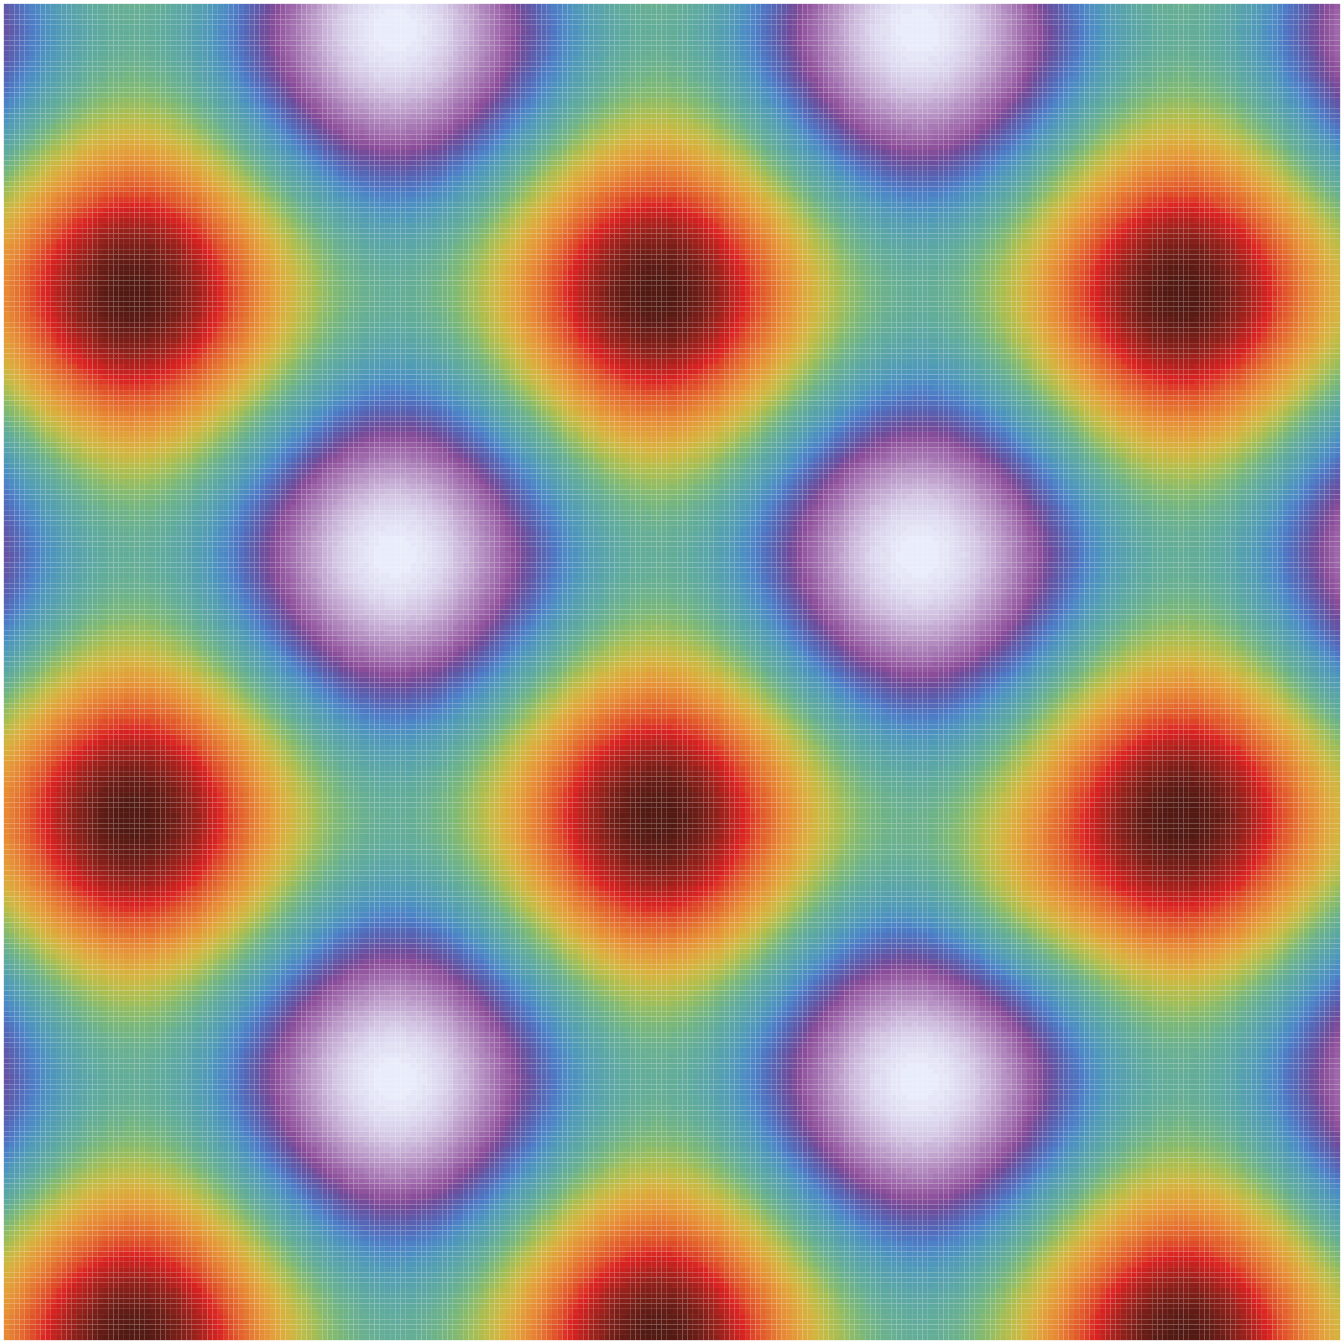
Diagnostic maps
Qualitative color schemes
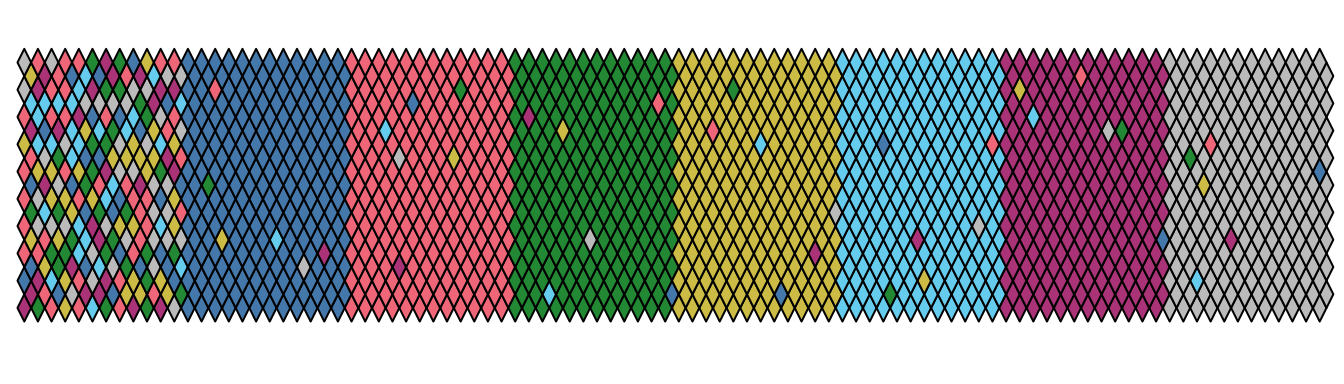
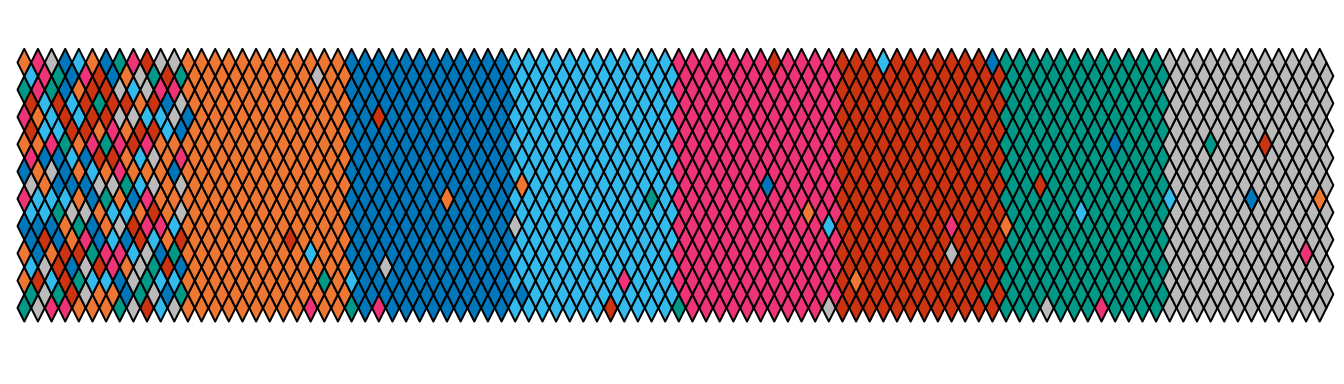
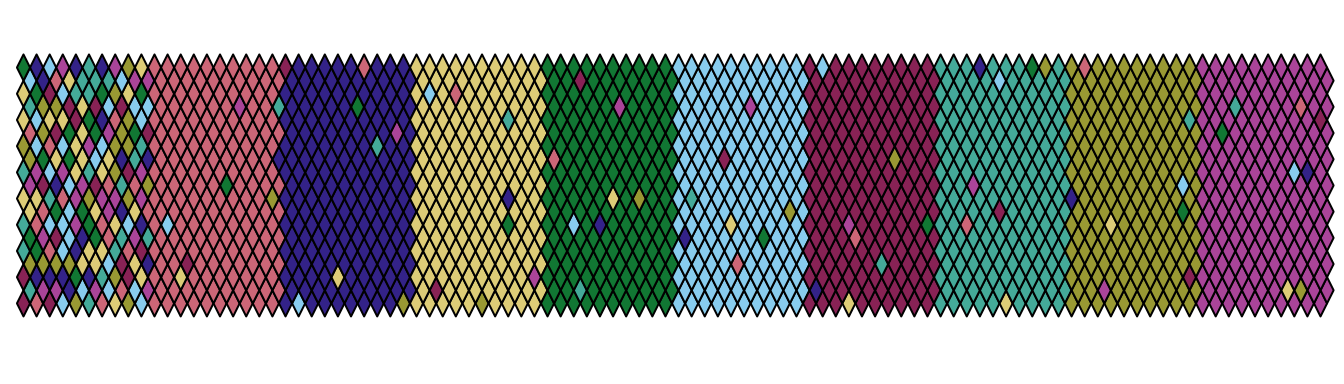
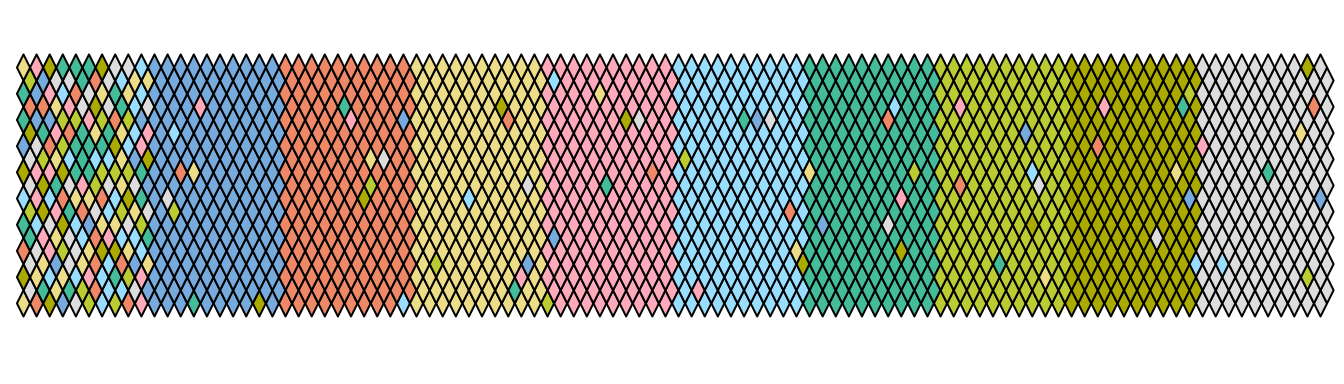
Diagnostic maps for the bright, vibrant, muted and light (from top to bottom) qualitative color schemes.
References
Tol, P. 2021. “Colour Schemes.” Technical note SRON/EPS/TN/09-002 3.2. SRON. URL: https://sronpersonalpages.nl/~pault/data/colourschemes.pdf.