Fabio Crameri's batlow Sequential Color Scheme
Source:R/scale_colour_crameri.R
scale_crameri_batlow.RdFabio Crameri's batlow Sequential Color Scheme
Usage
scale_colour_batlow(
  ...,
  reverse = FALSE,
  range = c(0, 1),
  discrete = FALSE,
  aesthetics = "colour"
)

scale_color_batlow(
  ...,
  reverse = FALSE,
  range = c(0, 1),
  discrete = FALSE,
  aesthetics = "colour"
)

scale_fill_batlow(
  ...,
  reverse = FALSE,
  range = c(0, 1),
  discrete = FALSE,
  aesthetics = "fill"
)

scale_edge_colour_batlow(
  ...,
  reverse = FALSE,
  range = c(0, 1),
  discrete = FALSE,
  aesthetics = "edge_colour"
)

scale_edge_color_batlow(
  ...,
  reverse = FALSE,
  range = c(0, 1),
  discrete = FALSE,
  aesthetics = "edge_colour"
)

scale_edge_fill_batlow(
  ...,
  reverse = FALSE,
  range = c(0, 1),
  discrete = FALSE,
  aesthetics = "edge_fill"
)
Source
Crameri, F. (2023). Scientific colour maps. Zenodo, v8.0.1. doi:10.5281/zenodo.1243862
Arguments
- ...
Arguments passed to
ggplot2::continuous_scale().- reverse
A
logicalscalar. Should the resulting vector of colors be reversed?- range
A length-two
numericvector specifying the fraction of the scheme's color domain to keep.- discrete
A
logicalscalar: should the color scheme be used as a discrete scale?- aesthetics
A
characterstring or vector of character strings listing the name(s) of the aesthetic(s) that this scale works with.
Value
A continuous scale.
Sequential Color Schemes
If more colors than defined are needed from a given scheme, the color coordinates are linearly interpolated to provide a continuous version of the scheme.
| Palette | Max. |
acton | 256 |
bamako | 256 |
batlow | 256 |
batlowW | 256 |
batlowK | 256 |
bilbao | 256 |
buda | 256 |
bukavu* | 256 |
davos | 256 |
devon | 256 |
fes* | 256 |
glasgow | 256 |
grayC | 256 |
hawaii | 256 |
imola | 256 |
lajolla | 256 |
lapaz | 256 |
navia | 256 |
naviaW | 256 |
nuuk | 256 |
oleron* | 256 |
oslo | 256 |
tokyo | 256 |
turku | 256 |
*: multisequential color schemes.
References
Crameri, F. (2018). Geodynamic diagnostics, scientific visualisation and StagLab 3.0. Geosci. Model Dev., 11, 2541-2562. doi:10.5194/gmd-11-2541-2018
Crameri, F., Shephard, G. E. & Heron, P. J. (2020). The misuse of colour in science communication. Nature Communications, 11, 5444. doi:10.1038/s41467-020-19160-7
See also
Other sequential color schemes:
scale_crameri_acton,
scale_crameri_bamako,
scale_crameri_batlowK,
scale_crameri_batlowW,
scale_crameri_bilbao,
scale_crameri_buda,
scale_crameri_davos,
scale_crameri_devon,
scale_crameri_glasgow,
scale_crameri_grayC,
scale_crameri_hawaii,
scale_crameri_imola,
scale_crameri_lajolla,
scale_crameri_lapaz,
scale_crameri_lipari,
scale_crameri_navia,
scale_crameri_naviaW,
scale_crameri_nuuk,
scale_crameri_oslo,
scale_crameri_tokyo,
scale_crameri_turku,
scale_tol_YlOrBr,
scale_tol_incandescent,
scale_tol_iridescent,
scale_tol_smoothrainbow
Other Fabio Crameri's color schemes:
scale_crameri_acton,
scale_crameri_bam,
scale_crameri_bamO,
scale_crameri_bamako,
scale_crameri_batlowK,
scale_crameri_batlowW,
scale_crameri_berlin,
scale_crameri_bilbao,
scale_crameri_broc,
scale_crameri_brocO,
scale_crameri_buda,
scale_crameri_bukavu,
scale_crameri_cork,
scale_crameri_corkO,
scale_crameri_davos,
scale_crameri_devon,
scale_crameri_fes,
scale_crameri_glasgow,
scale_crameri_grayC,
scale_crameri_hawaii,
scale_crameri_imola,
scale_crameri_lajolla,
scale_crameri_lapaz,
scale_crameri_lipari,
scale_crameri_lisbon,
scale_crameri_managua,
scale_crameri_navia,
scale_crameri_naviaW,
scale_crameri_nuuk,
scale_crameri_oleron,
scale_crameri_oslo,
scale_crameri_roma,
scale_crameri_romaO,
scale_crameri_tofino,
scale_crameri_tokyo,
scale_crameri_turku,
scale_crameri_vanimo,
scale_crameri_vik,
scale_crameri_vikO
Examples
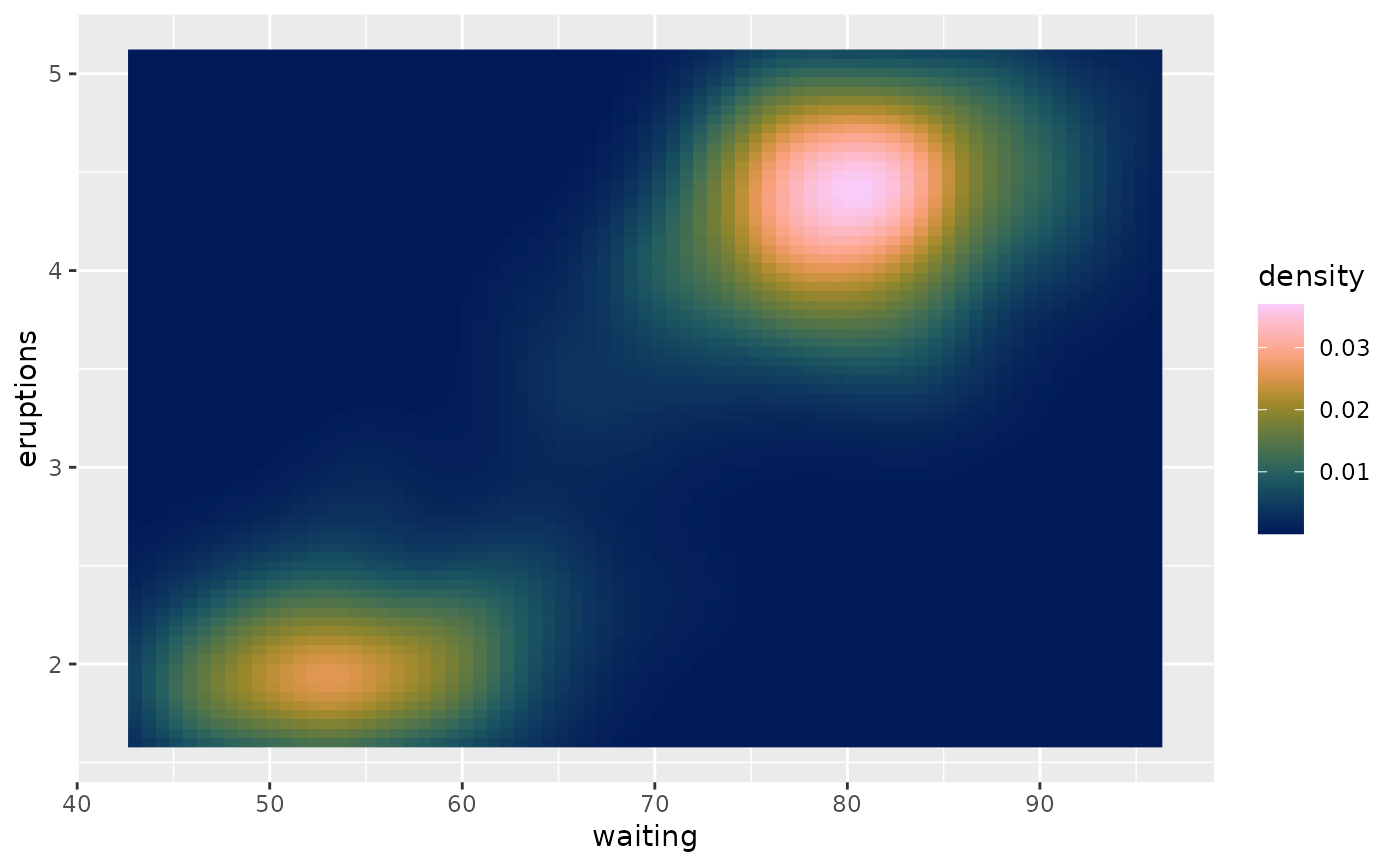
data(faithfuld, package = "ggplot2")
ggplot2::ggplot(faithfuld, ggplot2::aes(waiting, eruptions, fill = density)) +
ggplot2::geom_raster() +
scale_fill_batlow()
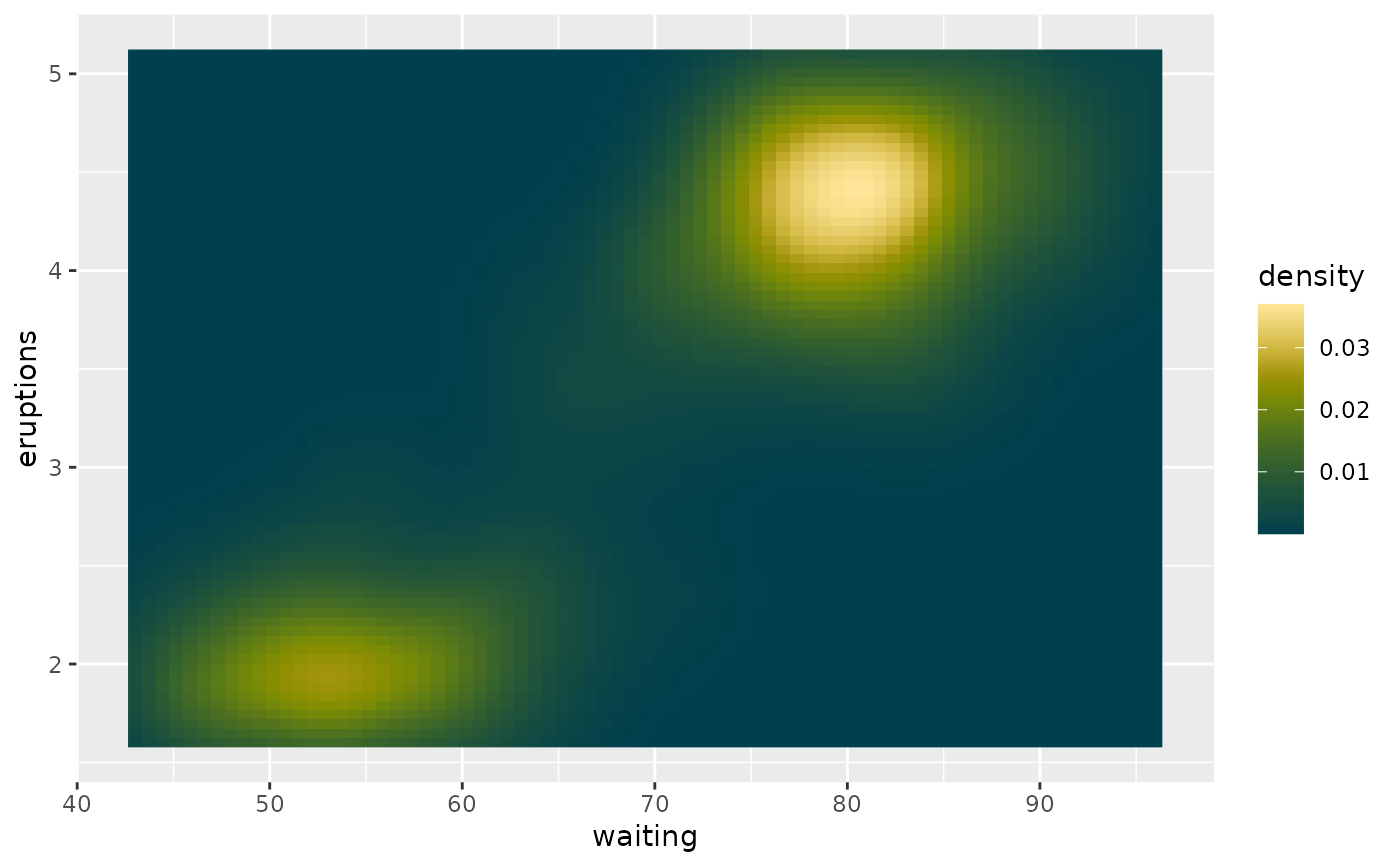
 ggplot2::ggplot(faithfuld, ggplot2::aes(waiting, eruptions, fill = density)) +
ggplot2::geom_raster() +
scale_fill_bamako()
ggplot2::ggplot(faithfuld, ggplot2::aes(waiting, eruptions, fill = density)) +
ggplot2::geom_raster() +
scale_fill_bamako()
 ggplot2::ggplot(faithfuld, ggplot2::aes(waiting, eruptions, fill = density)) +
ggplot2::geom_raster() +
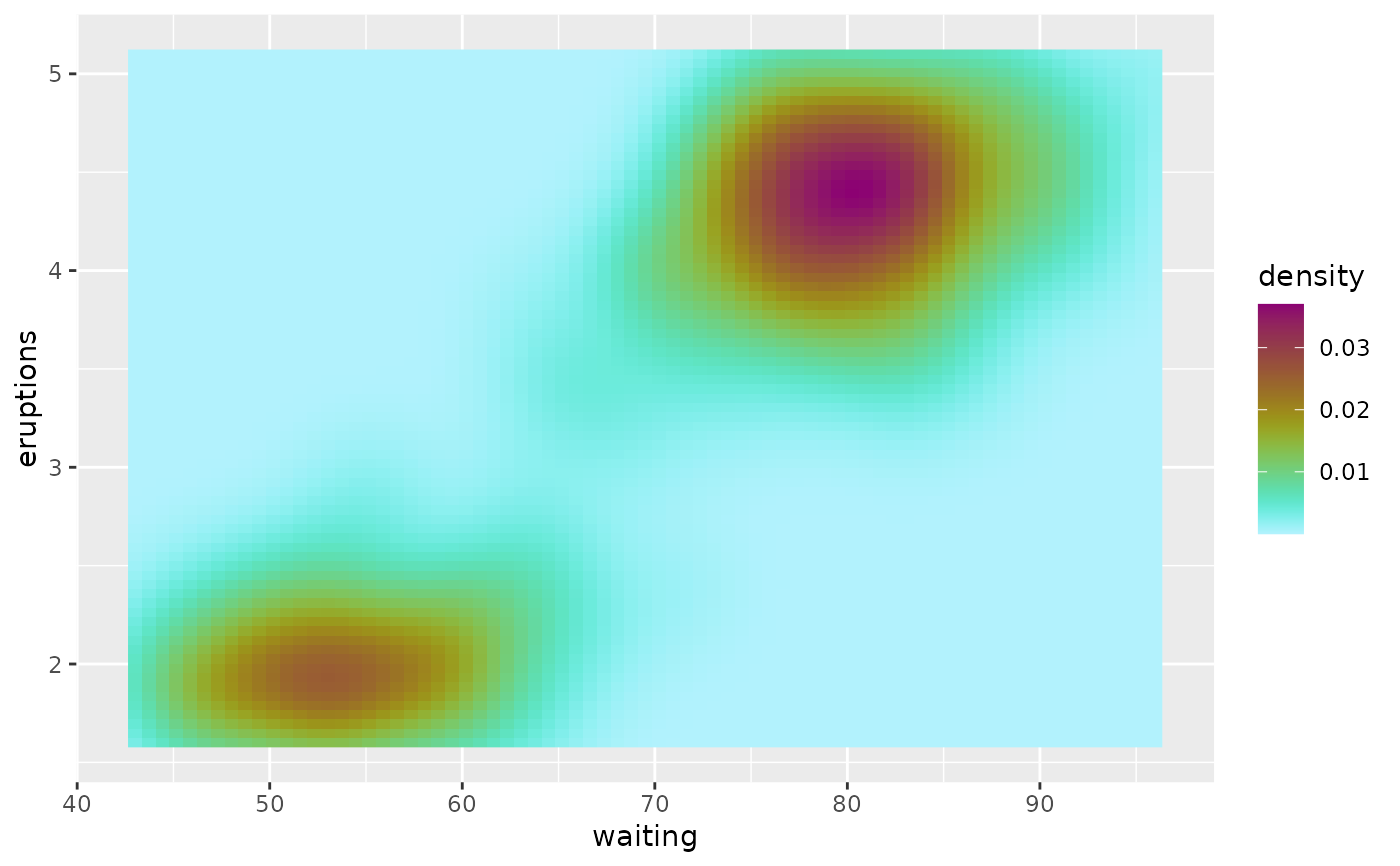
scale_fill_hawaii(reverse = TRUE)
ggplot2::ggplot(faithfuld, ggplot2::aes(waiting, eruptions, fill = density)) +
ggplot2::geom_raster() +
scale_fill_hawaii(reverse = TRUE)