CRAN packages:
13
Maintenance expected:
2
CRAN notes
Open issues:
6

Total commits:
3326
since 2018
Citations:
54
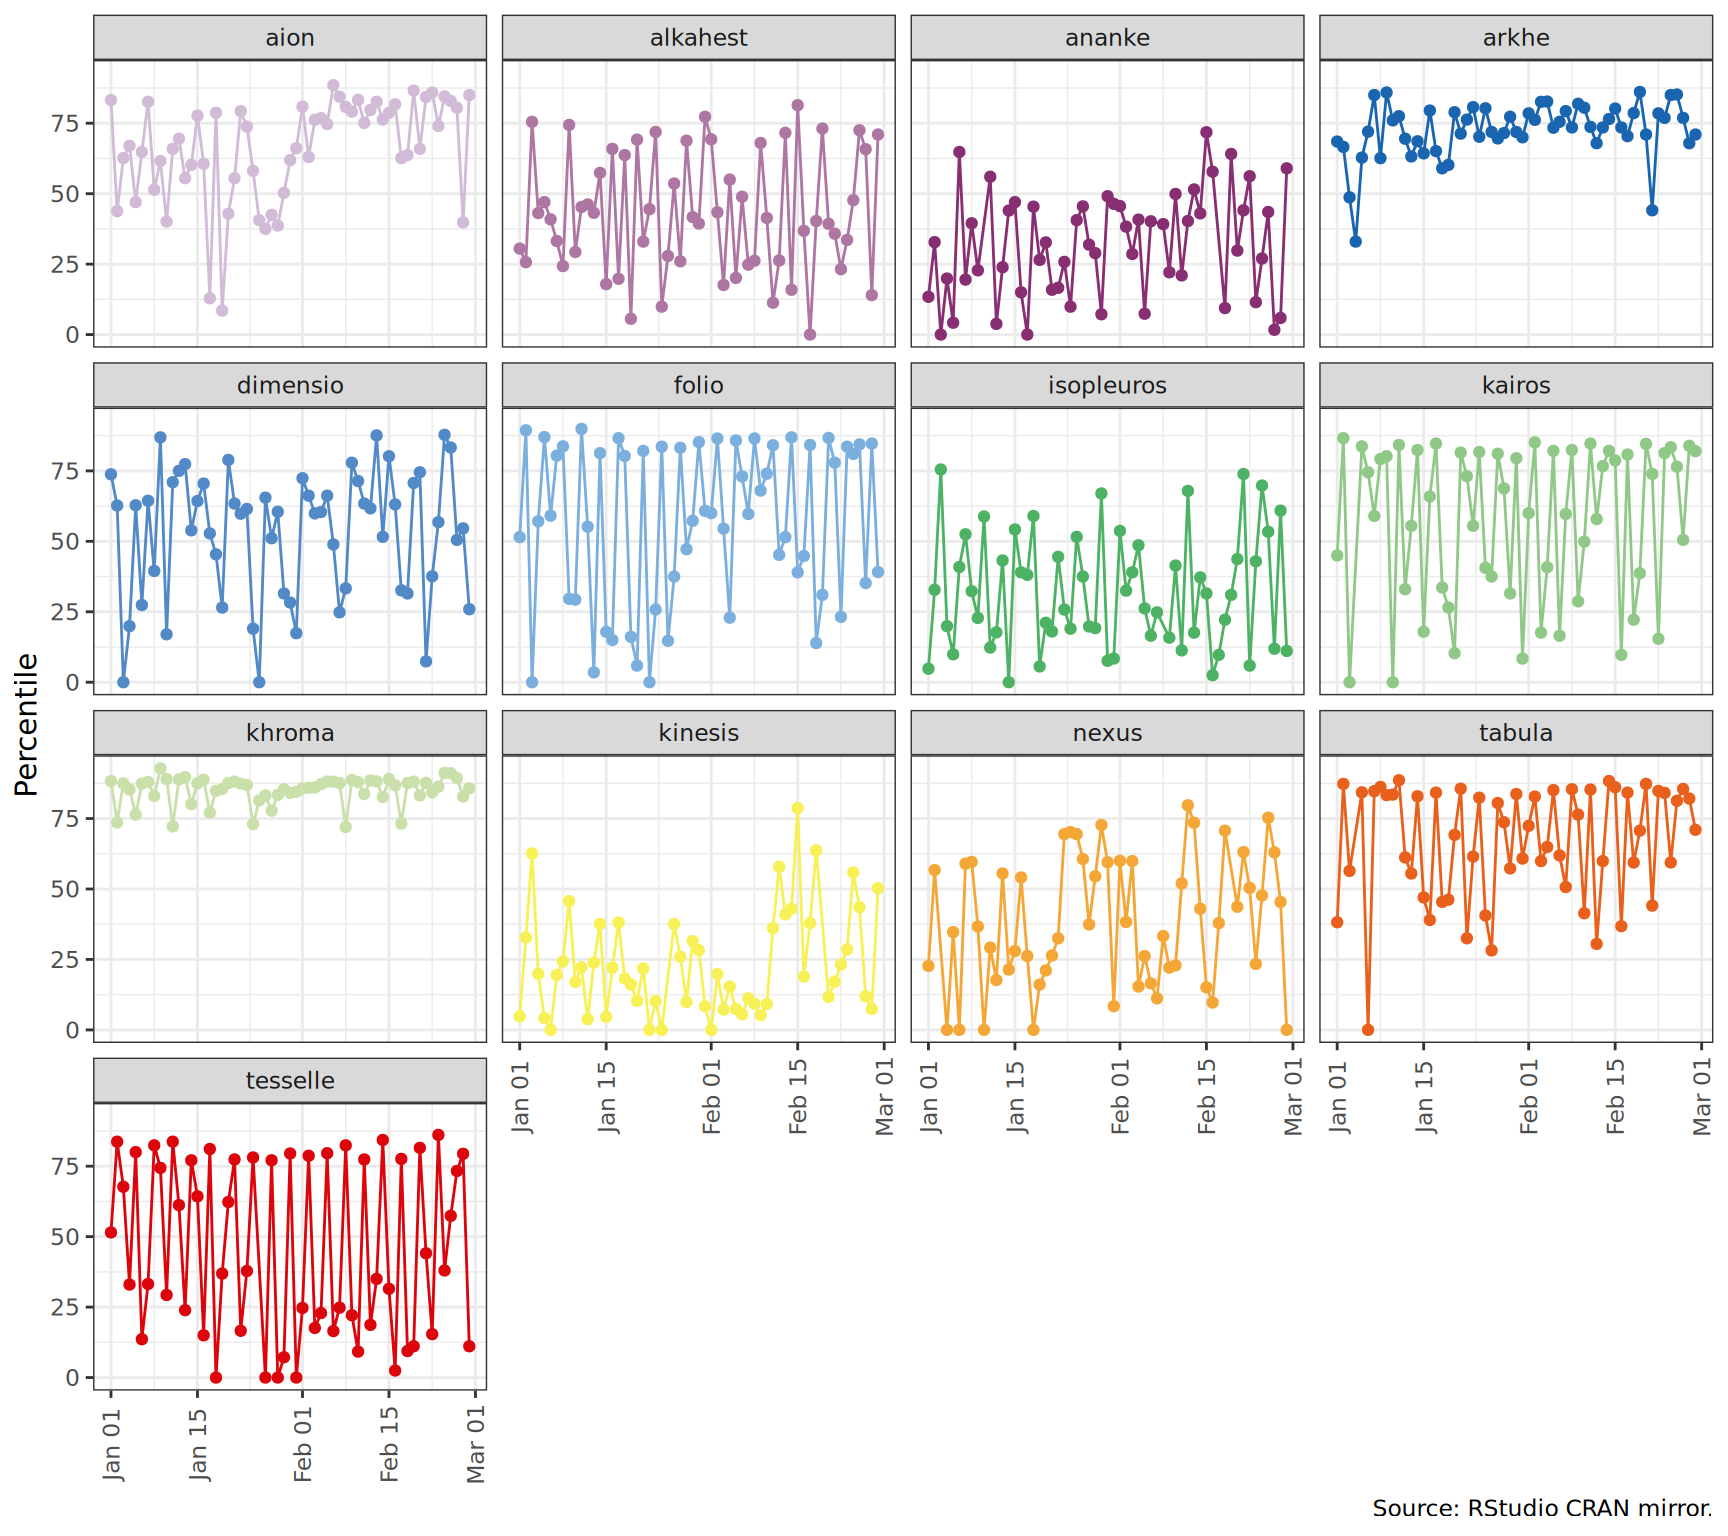
Package Download Percentile Rank
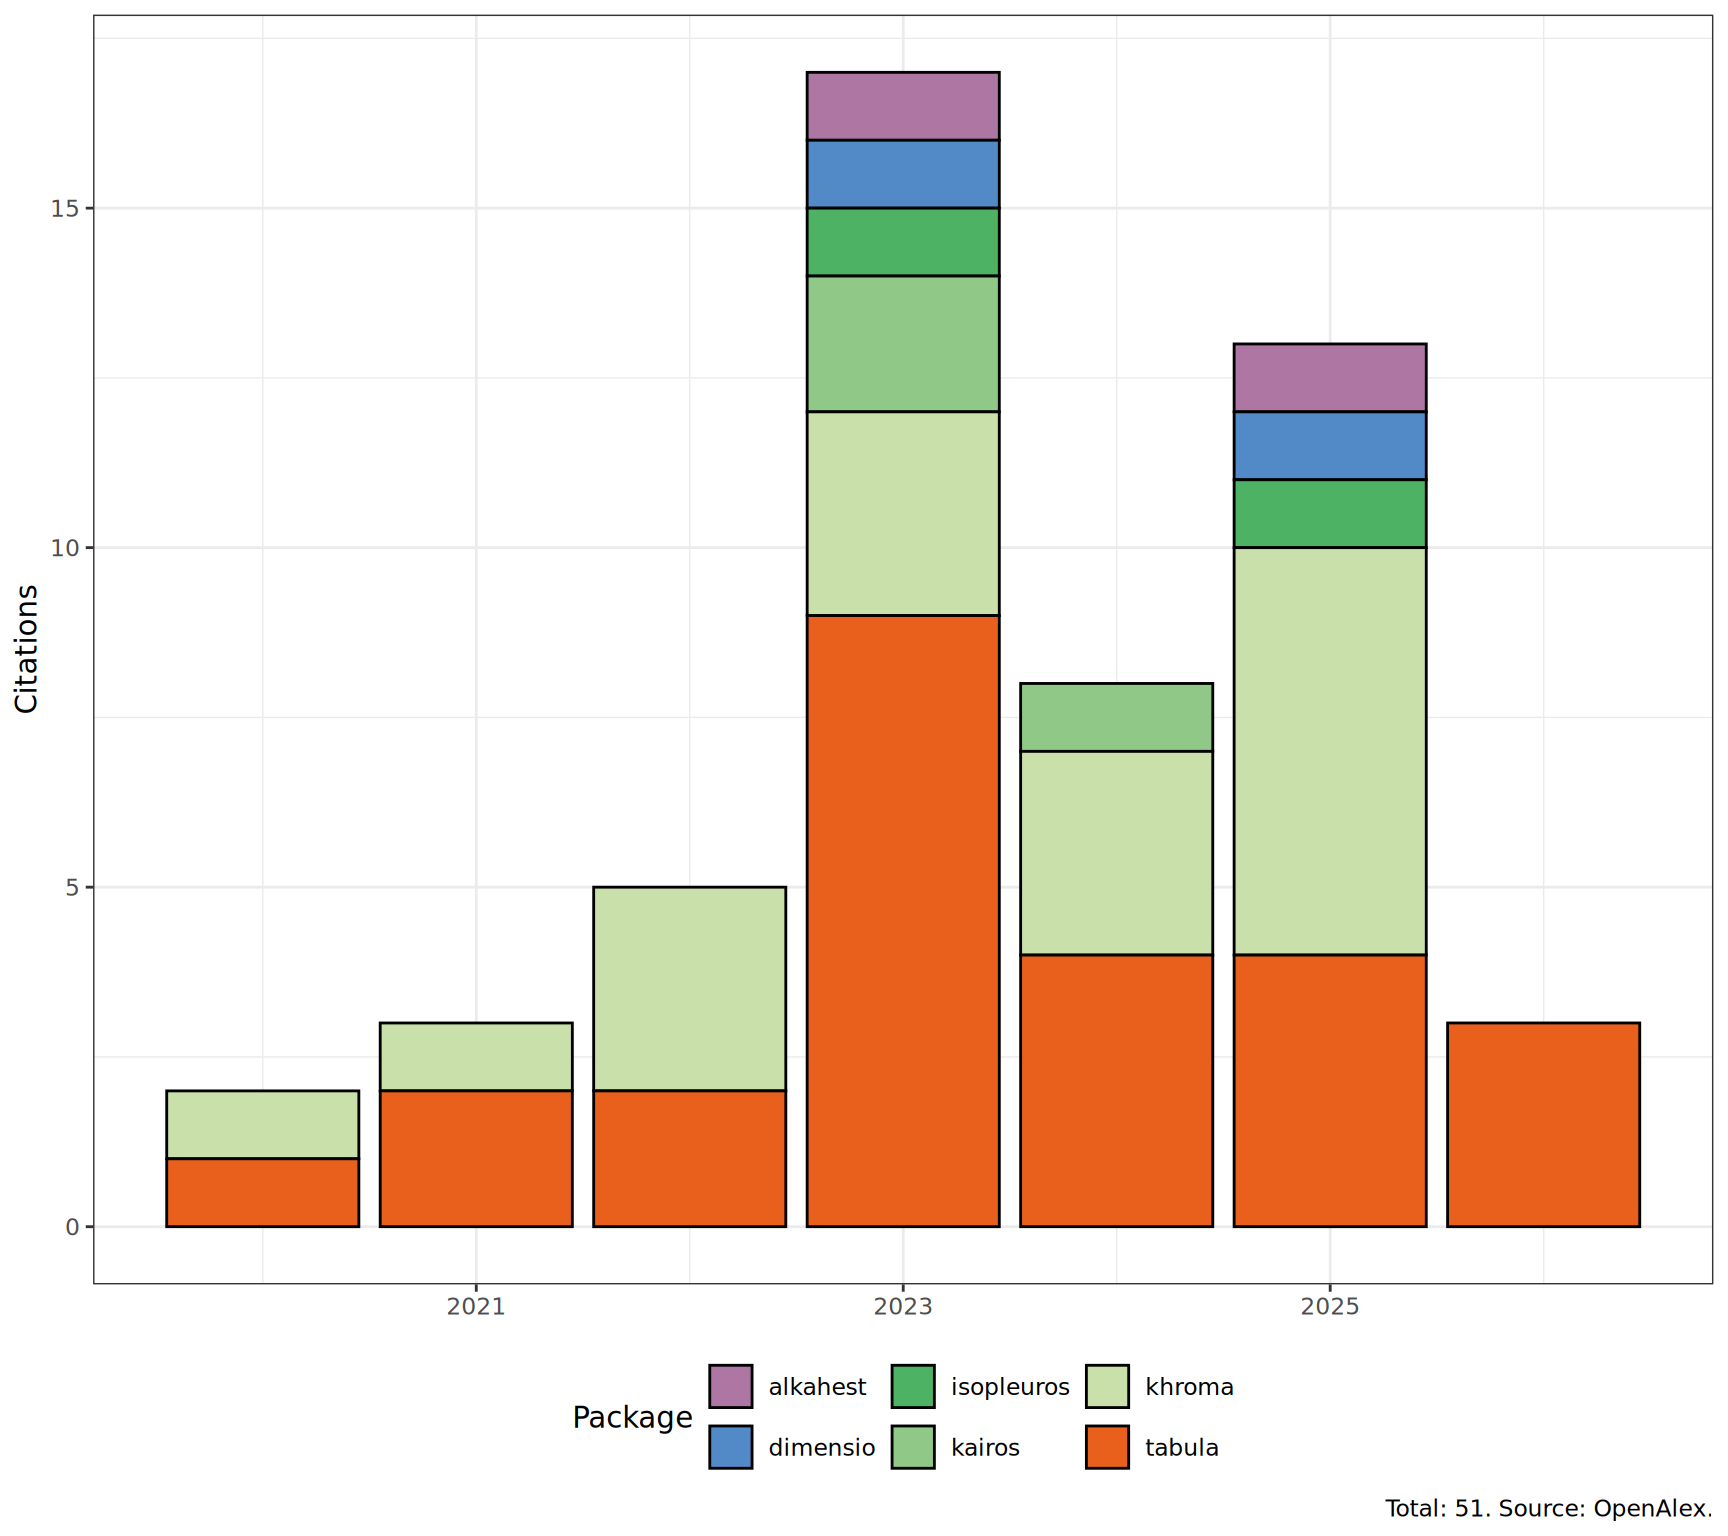
Package Citations
CRAN Info
Status
Open Issues
Citations
Source: OpenAlex
CRAN packages:
13
Maintenance expected:
2
CRAN notes
Open issues:
6
Total commits:
3326
since 2018
Citations:
54