

![]()

Overview
Base R ships with a lot of functionality useful for time series, in particular in the stats package. However, these features are not adapted to most archaeological time series. These are indeed defined for a given calendar era, they can involve dates very far in the past and the sampling of the observation time is (in most cases) not constant.
aion provides a system of classes and methods to represent and work with such time-series (and time intervals). Dates are represented as rata die (Reingold and Dershowitz 2018), i.e. the number of days since 01-01-01 (Gregorian), with negative values for earlier dates. This allows to represent dates independently of any calendar: it makes calculations and comparisons easier.
Once a time series is created with aion, any calendar can be used for printing or plotting data (defaults to Gregorian Common Era; see vignette("aion")).
aion does not provide tools for temporal modeling. Instead, it offers a simple API that can be used by other specialized packages (see kairos or ananke).
To cite aion in publications use:
Frerebeau N (2024). “aion: An R Package to Represent Archaeological Time Series.” Journal of Open Source Software, 9(96), 6210. doi:10.21105/joss.06210 https://doi.org/10.21105/joss.06210.
Frerebeau N, Roe J (2026). aion: Archaeological Time Series. Université Bordeaux Montaigne, Pessac, France. doi:10.5281/zenodo.8032278 https://doi.org/10.5281/zenodo.8032278. R package version 1.7.1, https://packages.tesselle.org/aion/.
This package is a part of the tesselle project https://www.tesselle.org.
Installation
You can install the released version of aion from CRAN with:
install.packages("aion")And the development version from Codeberg with:
# install.packages("remotes")
remotes::install_git("https://codeberg.org/tesselle/aion")
Usage
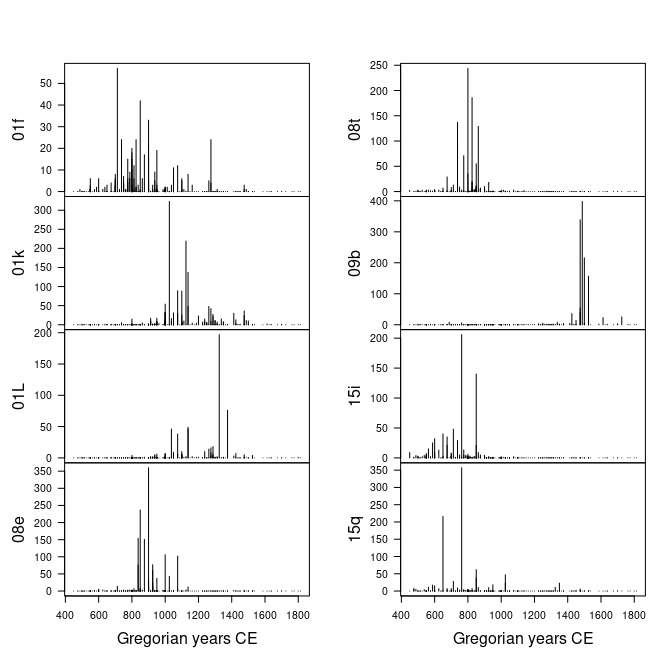
Time-series of ceramic counts:
## Get ceramic counts (data from Husi 2022)
data("loire", package = "folio")

## Keep only variables whose total is at least 600
keep <- c("01f", "01k", "01L", "08e", "08t", "09b", "15i", "15q")

## Get time midpoints
mid <- rowMeans(loire[, c("lower", "upper")])

## Create time-series
X <- series(
  object = loire[, keep],
  time = mid,
  calendar = AD()
)

## Plot (default calendar)
plot(
  x = X,
  type = "h" # histogram like vertical lines
)
Plot time ranges:
## Create time intervals
Y <- intervals(
  start = loire$lower,
  end = loire$upper,
  names = rownames(loire),
  calendar = AD()
)

## Plot (default calendar)
plot(x = Y)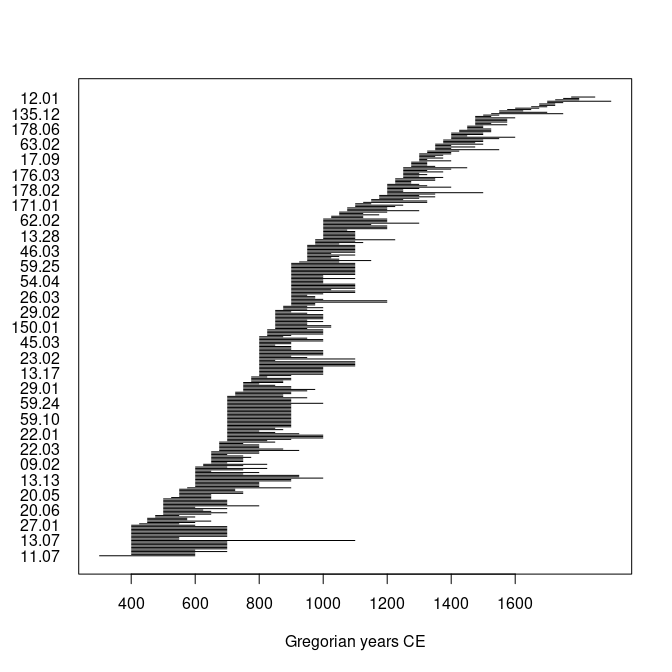
Translation
This package provides translations of user-facing communications, like messages, warnings and errors, and graphical elements (axis labels). The preferred language is by default taken from the locale. This can be overridden by setting of the environment variable LANGUAGE (you only need to do this once per session):
Sys.setenv(LANGUAGE = "<language code>")Languages currently available are English (en) and French (fr).
Related Works
- era provides a consistent representation of year-based time scales as a numeric vector with an associated era.
Contributing
Please note that the aion project is released with a Contributor Code of Conduct. By contributing to this project, you agree to abide by its terms.