

![]()
Overview
Ternary plots made simple. isopleuros allows to create ternary plots using base graphics. It provides functions to display the data in the ternary space, to add or tune graphical elements and to display statistical summaries. It also includes common ternary diagrams useful for the archaeologist (e.g. soil texture charts, ceramic phase diagram).
isopleuros is a dependency-free package1 designed to be as simple as possible.
To cite isopleuros in publications use:
Frerebeau N (2025). isopleuros: Ternary Plots. Université Bordeaux Montaigne, Pessac, France. doi:10.5281/zenodo.7940389 https://doi.org/10.5281/zenodo.7940389, R package version 1.4.0, https://packages.tesselle.org/isopleuros/.
This package is a part of the tesselle project https://www.tesselle.org.
Installation
You can install the released version of isopleuros from CRAN with:
install.packages("isopleuros")And the development version from Codeberg with:
# install.packages("remotes")
remotes::install_git("https://codeberg.org/tesselle/isopleuros")
Usage
## Load package
library(isopleuros)
## Graphical parameters
par(mfrow = c(1, 2), mar = c(0, 0, 0, 0) + 0.1)

## Set colors
col <- c("blue", "red")

## Ternary plot
## (data from Aitchison 1986)
ternary_plot(
  x = lava,
  panel.first = ternary_grid(),
  col = col[as.factor(lava$A > 30)],
)

## Split data
groups <- split(lava, f = lava$A > 30)

## Add tolerance ellipses
for (i in seq_along(groups)) {
  ternary_tolerance(groups[[i]], level = 0.975, lty = 2, border = col[[i]])
}

## Density contours
ternary_plot(lava, panel.first = ternary_grid())
ternary_density(lava, n = 500, nlevels = 10)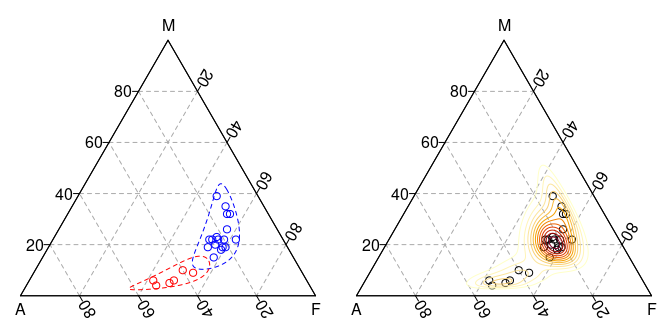
## Install extra package (if needed)
# install.packages("folio")

## Data from Barrera and Velde 1989
data("verre", package = "folio")

## Select data
coda <- verre[, c("Na2O", "CaO", "K2O", "MgO", "P2O5", "Al2O3")]

## Ternary plots with marginal compositions
ternary_pairs(coda, col = as.factor(coda$Na2O > 5))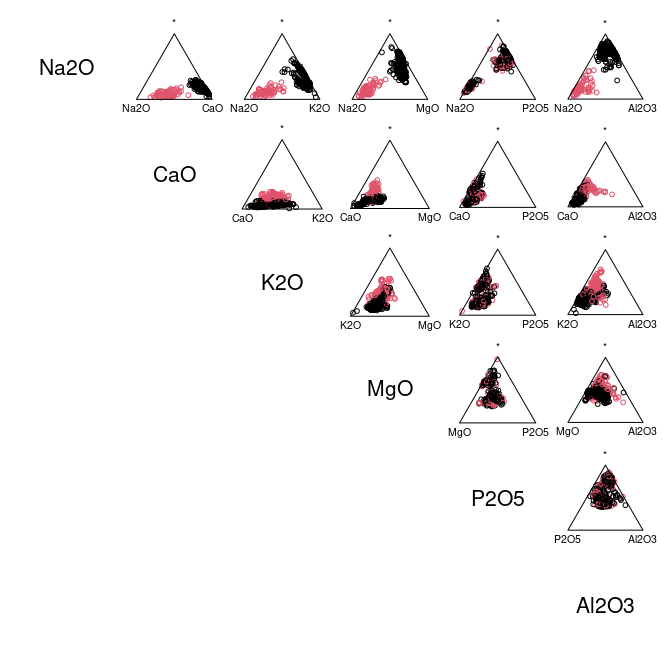
## Graphical parameters
par(mfrow = c(2, 2), mar = c(0, 0, 0, 0) + 0.1)

## Ceramic phase diagram
ternary_plot(NULL, axes = FALSE, ann = FALSE, frame.plot = TRUE)
triangle_phase_cas(symbol = TRUE, pch = 16)

ternary_plot(NULL, xlab = "CaO", ylab = "Al2O3", zlab = "SiO2")
triangle_phase_ceramic(symbol = TRUE, pch = 16)

## HYPRES soil texture
ternary_plot(NULL, xlab = "sand", ylab = "silt", zlab = "clay")
triangle_soil_hypres()

## USDA (1951) soil texture
ternary_plot(NULL, xlab = "sand", ylab = "silt", zlab = "clay")
triangle_soil_usda(symbol = TRUE)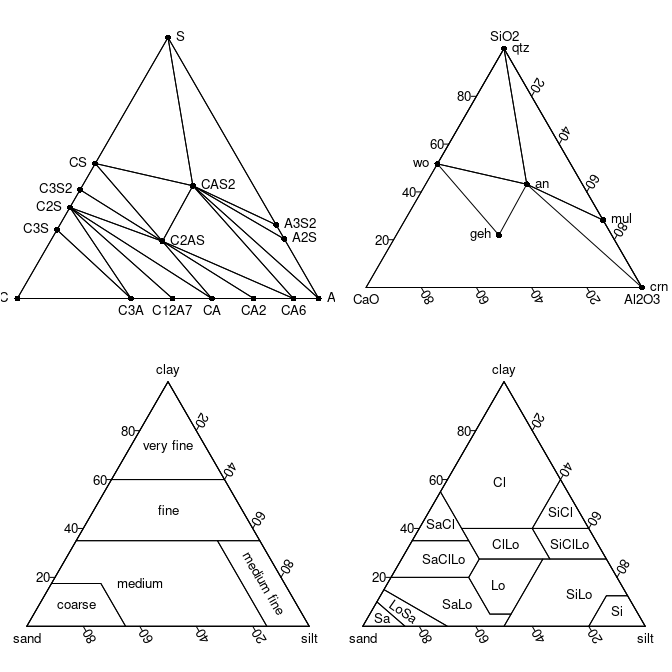
Translation
This package provides translations of user-facing communications, like messages, warnings and errors. The preferred language is by default taken from the locale. This can be overridden by setting of the environment variable LANGUAGE (you only need to do this once per session):
Sys.setenv(LANGUAGE = "<language code>")Languages currently available are English (en) and French (fr).
Contributing
Please note that the isopleuros project is released with a Contributor Code of Conduct. By contributing to this project, you agree to abide by its terms.