Plot a Radiocarbon Event Count Ensemble
Usage
# S4 method for class 'RECE,missing'
plot(x, calendar = get_calendar(), ...)
Arguments
- x
An
RECEobject.- calendar
An
aion::TimeScaleobject specifying the target calendar (seeaion::calendar()). IfNULL, rata die are returned.- ...
Further parameters to be passed to
graphics::image().
Value
plot() is called it for its side-effects: it results in a graphic being
displayed (invisibly returns x).
References
Carleton, W. C. (2021). Evaluating Bayesian Radiocarbon‐dated Event Count (REC) Models for the Study of Long‐term Human and Environmental Processes. Journal of Quaternary Science, 36(1): 110‑23. doi:10.1002/jqs.3256 .
See also
Other radiocarbon tools:
F14C,
c14_calibrate(),
c14_combine(),
c14_count(),
c14_curve(),
c14_plot,
c14_sample(),
c14_spd(),
c14_uncalibrate(),
ridgelines()
Examples
# \donttest{
## Radiocarbon data from Bosch et al. 2015
data("ksarakil")
## Calibrate
cal <- c14_calibrate(
values = ksarakil$date,
errors = ksarakil$error,
names = ksarakil$code,
curves = "marine13",
reservoir_offsets = 53,
reservoir_errors = 43,
from = 50000, to = 0
)
## RECE
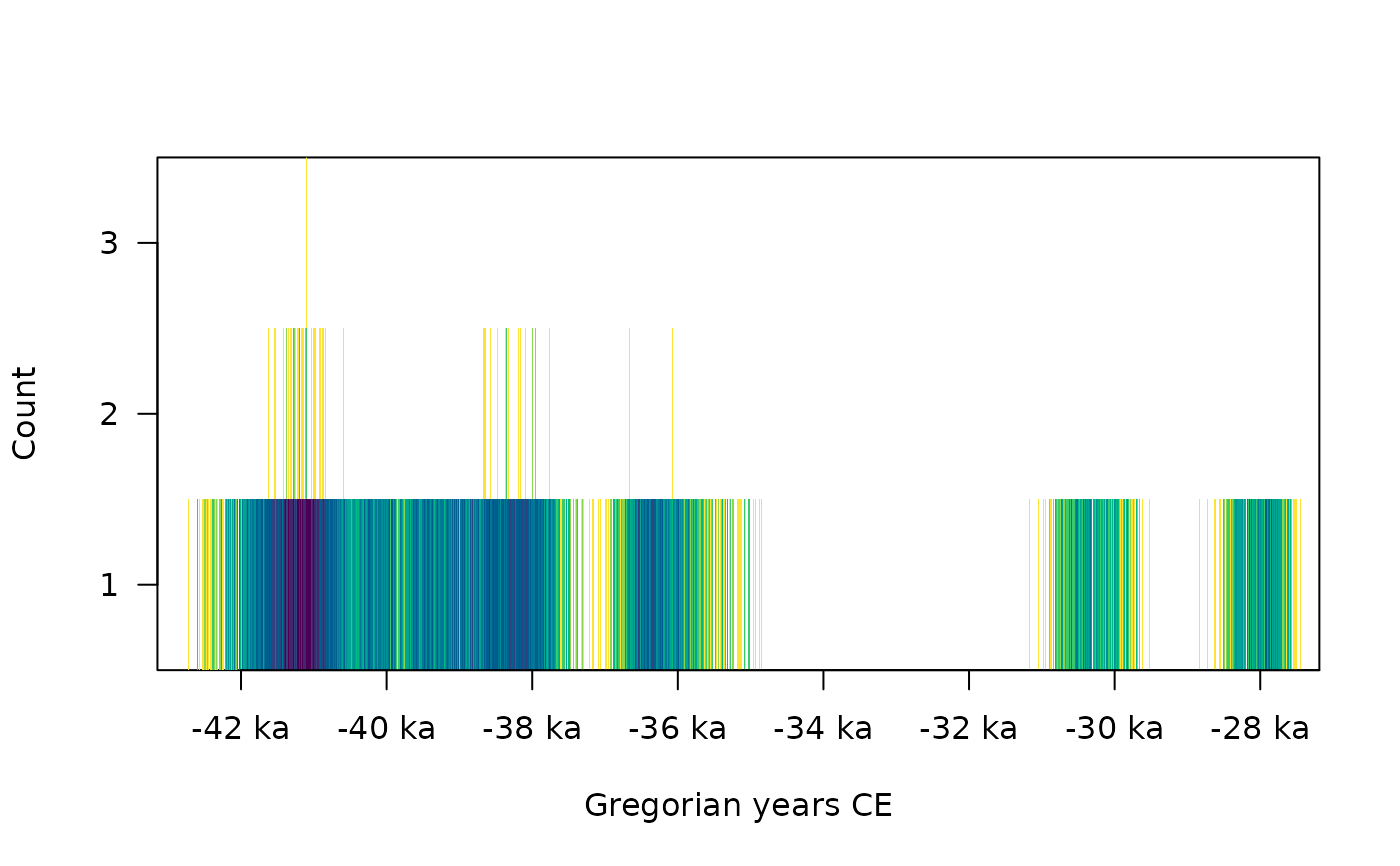
tmp <- c14_count(cal, n = 500)
plot(tmp, col = grDevices::hcl.colors(12, "Viridis", rev = TRUE))
 # }
# }