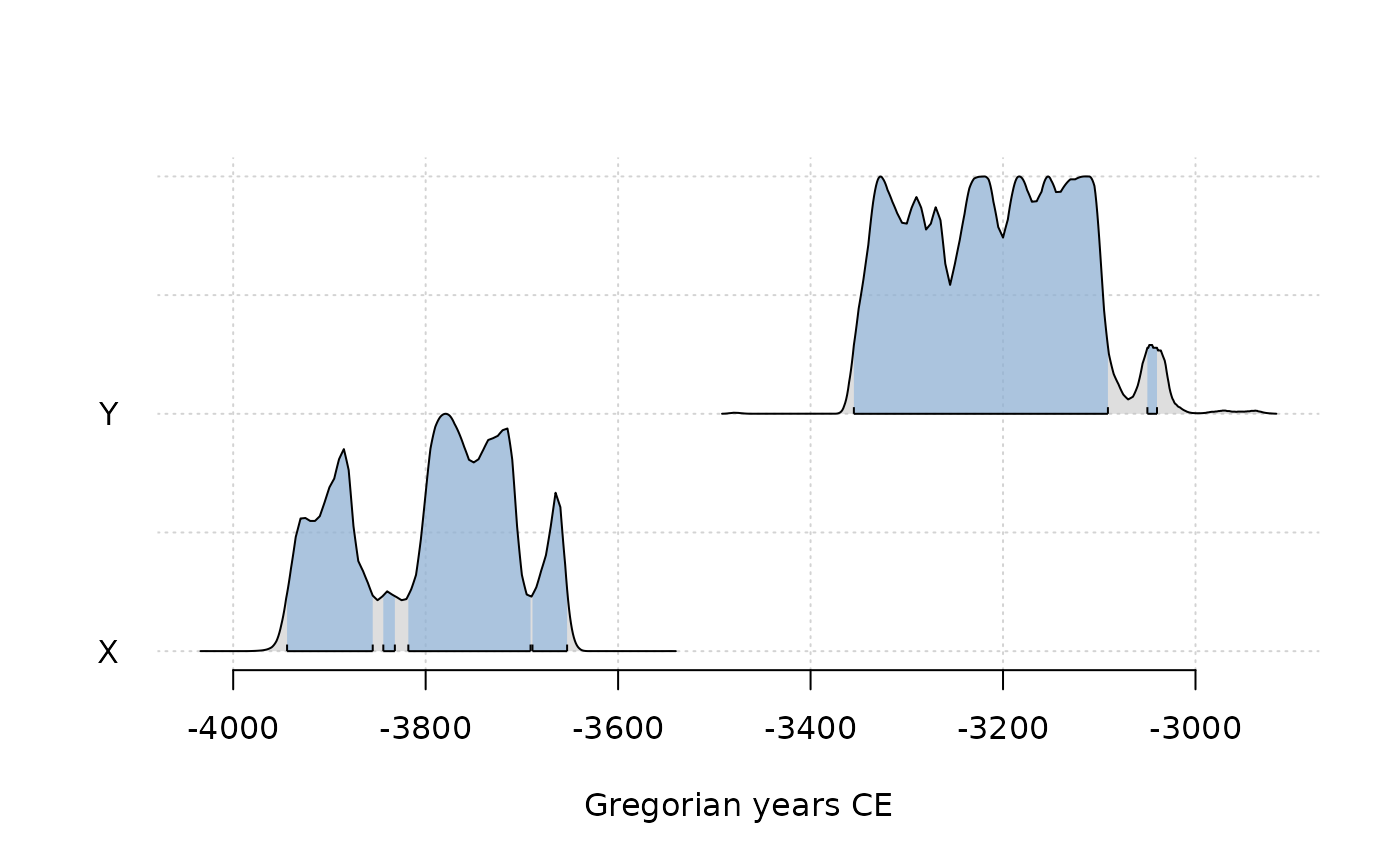
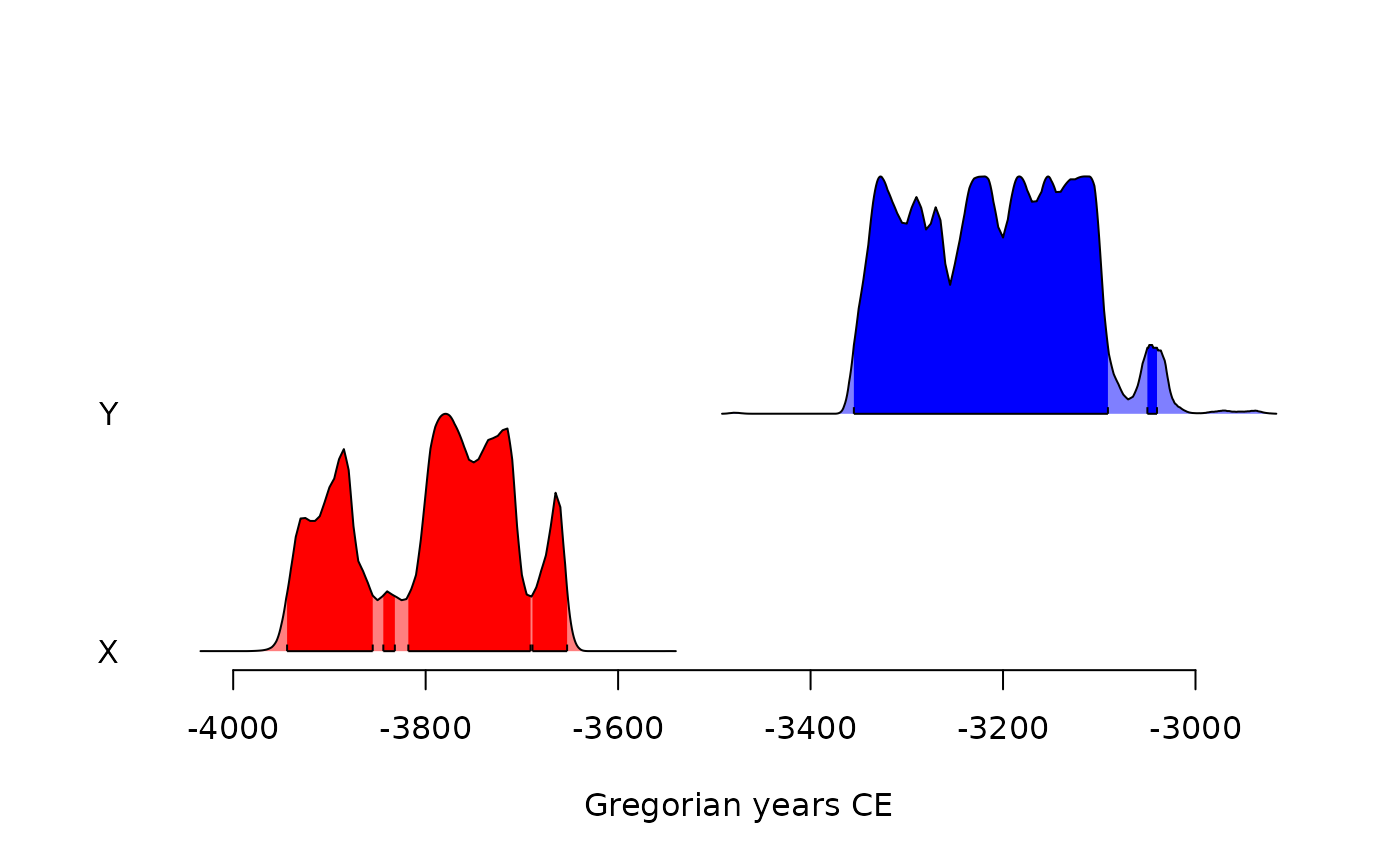
Ridgeline Plot of Calibrated Radiocarbon Ages
Usage
ridgelines(x, ...)

# S4 method for class 'CalibratedAges'
ridgelines(
  x,
  calendar = get_calendar(),
  interval = c("hdr", "credible"),
  level = 0.954,
  fixed = TRUE,
  decreasing = FALSE,
  col = "grey",
  ...
)
Arguments
- x
A
CalibratedAgesorCalibratedSPDobject.- ...
Further parameters to be passed to
aion::plot().- calendar
An
aion::TimeScaleobject specifying the target calendar (seeaion::calendar()). IfNULL, rata die are returned.- interval
A
characterstring specifying the intervals to be drawn. It must be one of "hrd" (the default) or "credible". Any unambiguous substring can be given.- level
A length-one
numericvector giving the confidence level. Only used ifintervalisTRUE.- fixed
A
logicalscalar: should a fixed y scale be used? IfTRUE(the default), ages are equally spaced along the y axis and arranged in chronological order. IfFALSE, agepositionsare used (seec14_calibrate()).- decreasing
A
logicalscalar: should the sort order be decreasing?- col
A specification for the plotting colors.
Value
ridgelines() is called it for its side-effects: it results in a graphic
being displayed (invisibly returns x).
See also
Other radiocarbon tools:
F14C,
c14_calibrate(),
c14_combine(),
c14_count(),
c14_curve(),
c14_plot,
c14_sample(),
c14_spd(),
c14_uncalibrate(),
rec_plot