Plots ellipses.
Usage
viz_ellipses(x, y, ...)

# S4 method for class 'numeric,numeric'
viz_ellipses(
  x,
  y,
  ...,
  group = NULL,
  type = c("tolerance", "confidence"),
  level = 0.95,
  color = NULL,
  fill = FALSE,
  symbol = FALSE
)

# S4 method for class 'MultivariateAnalysis,missing'
viz_ellipses(
  x,
  ...,
  group = NULL,
  type = c("tolerance", "confidence"),
  level = 0.95,
  color = NULL,
  fill = FALSE,
  symbol = FALSE
)

# S4 method for class 'PCOA,missing'
viz_ellipses(
  x,
  ...,
  group = NULL,
  type = c("tolerance", "confidence"),
  level = 0.95,
  color = NULL,
  fill = FALSE,
  symbol = FALSE
)
Arguments
- x, y
A
numericvector. Ifyis missing,xmust be an object from which to wrap observations (aCA,MCAorPCAobject).- ...
Further graphical parameters to be passed to
graphics::polygon().- group
A vector specifying the group an observation belongs to.
- type
A
characterstring specifying the ellipse to draw. It must be one of "tolerance" or "confidence"). Any unambiguous substring can be given.- level
A
numericvector specifying the confidence/tolerance level.- color
The colors for borders (will be mapped to
group). Ignored if set toFALSE. IfNULL, the default color scheme will be used.- fill
The background colors (will be mapped to
group). Ignored if set toFALSE.- symbol
A vector of symbols (will be mapped to
group). Ignored if set toFALSE.
Value
viz_ellipses()is called for its side-effects: it results in a graphic
being displayed. Invisibly returns x.
See also
Other envelopes:
viz_confidence(),
viz_hull(),
viz_tolerance()
Examples
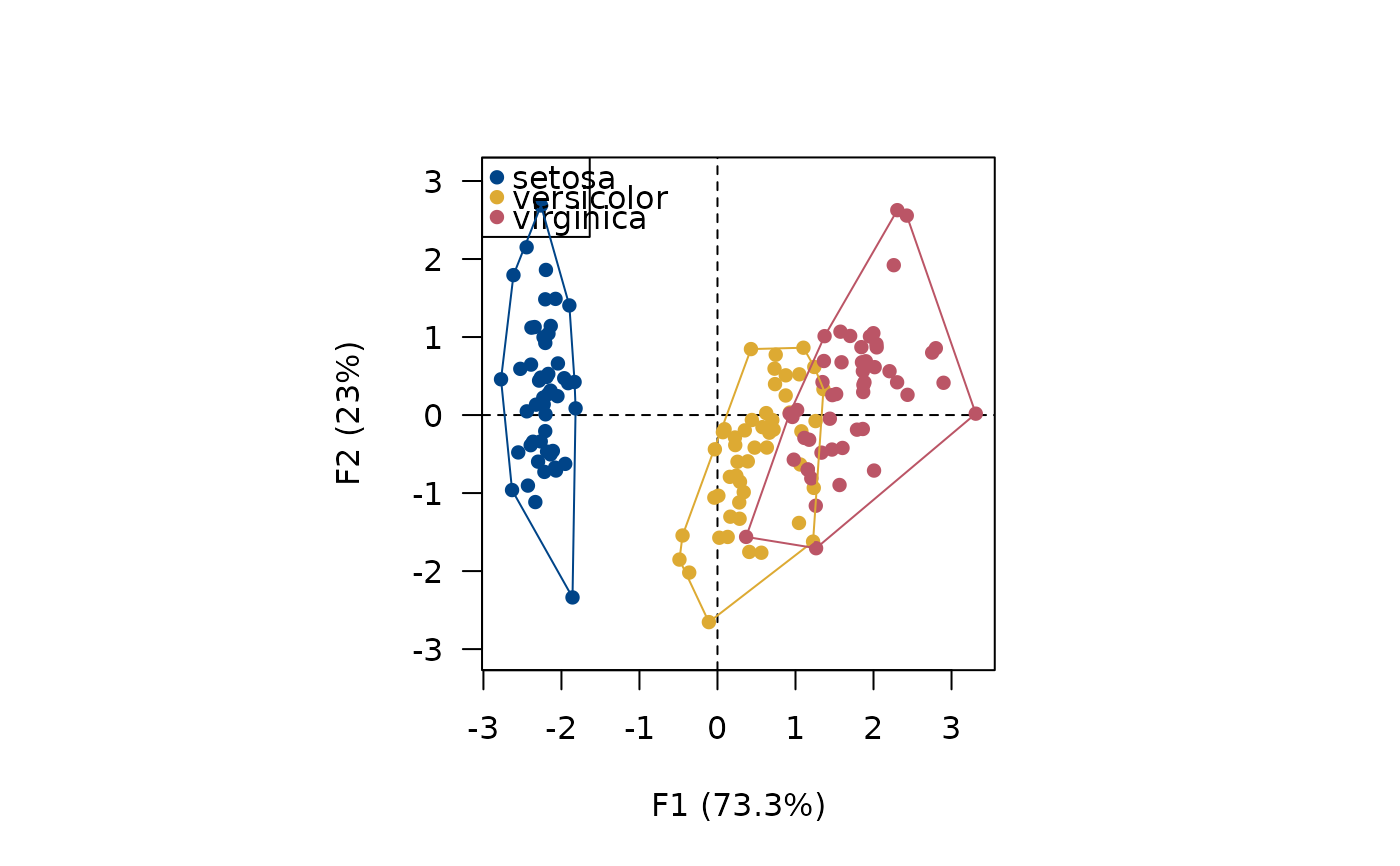
## Load data
data("iris")

## Compute principal components analysis
X <- pca(iris, scale = TRUE, sup_quali = "Species")

## Plot with tolerance ellipses
col <- c("#004488", "#DDAA33", "#BB5566")
viz_rows(X, extra_quali = iris$Species, color = col)
viz_ellipses(
  x = X,
  type = "tolerance",
  level = c(0.68, 0.95),
  group = iris$Species,
  color = col
)