Frequency Increment Test
Arguments
- object
A \(m \times p\)
numericmatrixordata.frameof count data (absolute frequencies giving the number of individuals for each category, i.e. a contingency table). Adata.framewill be coerced to anumericmatrixviadata.matrix().- dates
A length-\(m\)
numericvector of dates.- ...
Currently not used.
- calendar
An
aion::TimeScaleobject specifying the calendar ofdates(seeaion::calendar()). Defaults to Gregorian Common Era.- level
A length-one
numericvector giving the confidence level.- roll
A
logicalscalar: should each time series be subsetted to look for episodes of selection?- window
An odd
integergiving the size of the rolling window. Only used ifrollisTRUE.
Value
An IncrementTest object.
Details
The Frequency Increment Test (FIT) rejects neutrality if the distribution of normalized variant frequency increments exhibits a mean that deviates significantly from zero.
If roll is TRUE, each time series is subsetted according to window to
see if episodes of selection can be identified among variables that might
not show overall selection.
References
Feder, A. F., Kryazhimskiy, S. & Plotkin, J. B. (2014). Identifying Signatures of Selection in Genetic Time Series. Genetics, 196(2): 509-522. doi:10.1534/genetics.113.158220 .
See also
Other chronological analysis:
apportion()
Examples
## Data from Crema et al. 2016
data("merzbach", package = "folio")
## Keep only decoration types that have a maximum frequency of at least 50
keep <- apply(X = merzbach, MARGIN = 2, FUN = function(x) max(x) >= 50)
counts <- merzbach[, keep]
## Group by phase
## We use the row names as time coordinates (roman numerals)
dates <- as.numeric(utils::as.roman(rownames(counts)))
## Frequency Increment Test
freq <- fit(counts, dates, calendar = NULL)
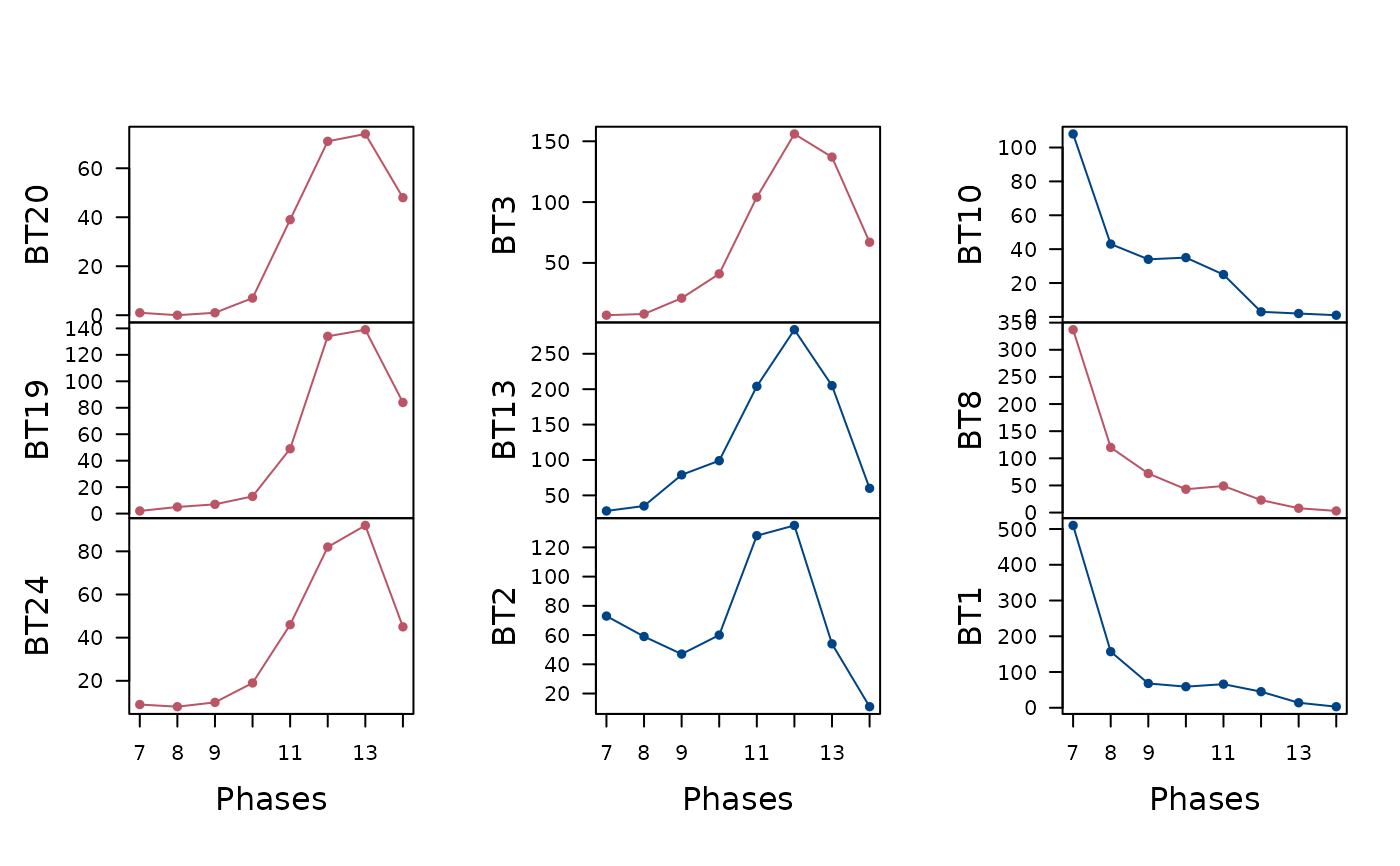
## Plot time vs abundance
plot(freq, calendar = NULL, ncol = 3, xlab = "Phases")
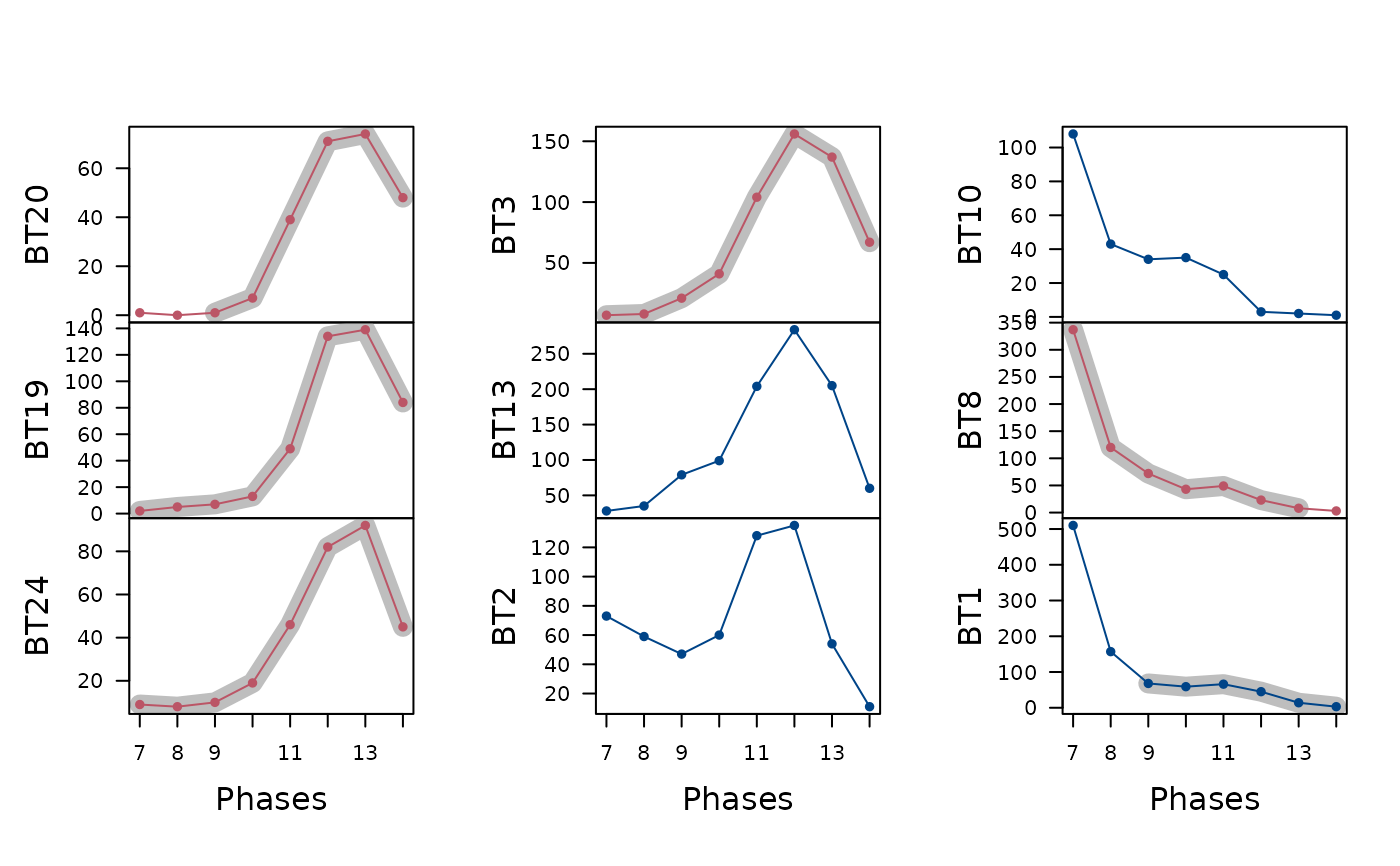
 ## Plot time vs abundance and highlight selection
freq <- fit(counts, dates, calendar = NULL, roll = TRUE, window = 5)
plot(freq, calendar = NULL, ncol = 3, xlab = "Phases")
## Plot time vs abundance and highlight selection
freq <- fit(counts, dates, calendar = NULL, roll = TRUE, window = 5)
plot(freq, calendar = NULL, ncol = 3, xlab = "Phases")