Produces an activity or a tempo plot.
Usage
# S4 method for class 'EventDate,missing'
plot(
  x,
  type = c("activity", "tempo"),
  event = FALSE,
  calendar = get_calendar(),
  select = 1,
  n = 500,
  eps = 1e-09,
  col.accumulation = "black",
  col.event = "red",
  flip = FALSE,
  ncol = NULL,
  xlab = NULL,
  ylab = NULL,
  main = NULL,
  sub = NULL,
  ann = graphics::par("ann"),
  axes = TRUE,
  frame.plot = axes,
  ...
)
Arguments
- x
An
EventDateobject.- type
A
characterstring indicating the type of plot. It must be one of "activity" (default) or "tempo" (see details). Any unambiguous substring can be given.- event
A
logicalscalar: should the distribution of the event date be displayed? Only used if type is "activity".- calendar
An
aion::TimeScaleobject specifying the target calendar (seeaion::calendar()).- select
A
numericorcharactervector giving the selection of the assemblage that are drawn.- n
A length-one non-negative
numericvector giving the desired length of the vector of quantiles for density computation.- eps
A length-one
numericvalue giving the cutoff below which values will be removed.- col.accumulation
A color specification for the accumulation density curve.
- col.event
A color specification for the event density curve.
- flip
A
logicalscalar: should the y-axis (ticks and numbering) be flipped from side 2 (left) to 4 (right) from series to series whenfacetis "multiple"?- ncol
An
integerspecifying the number of columns to use whenfacetis "multiple". Defaults to 1 for up to 4 series, otherwise to 2.- xlab, ylab
A
charactervector giving the x and y axis labels.- main
A
characterstring giving a main title for the plot.- sub
A
characterstring giving a subtitle for the plot.- ann
A
logicalscalar: should the default annotation (title and x and y axis labels) appear on the plot?- axes
A
logicalscalar: should axes be drawn on the plot?- frame.plot
A
logicalscalar: should a box be drawn around the plot?- ...
Further parameters to be passed to
panel(e.g. graphical parameters).
Value
plot() is called it for its side-effects: it results in a graphic being
displayed (invisibly returns x).
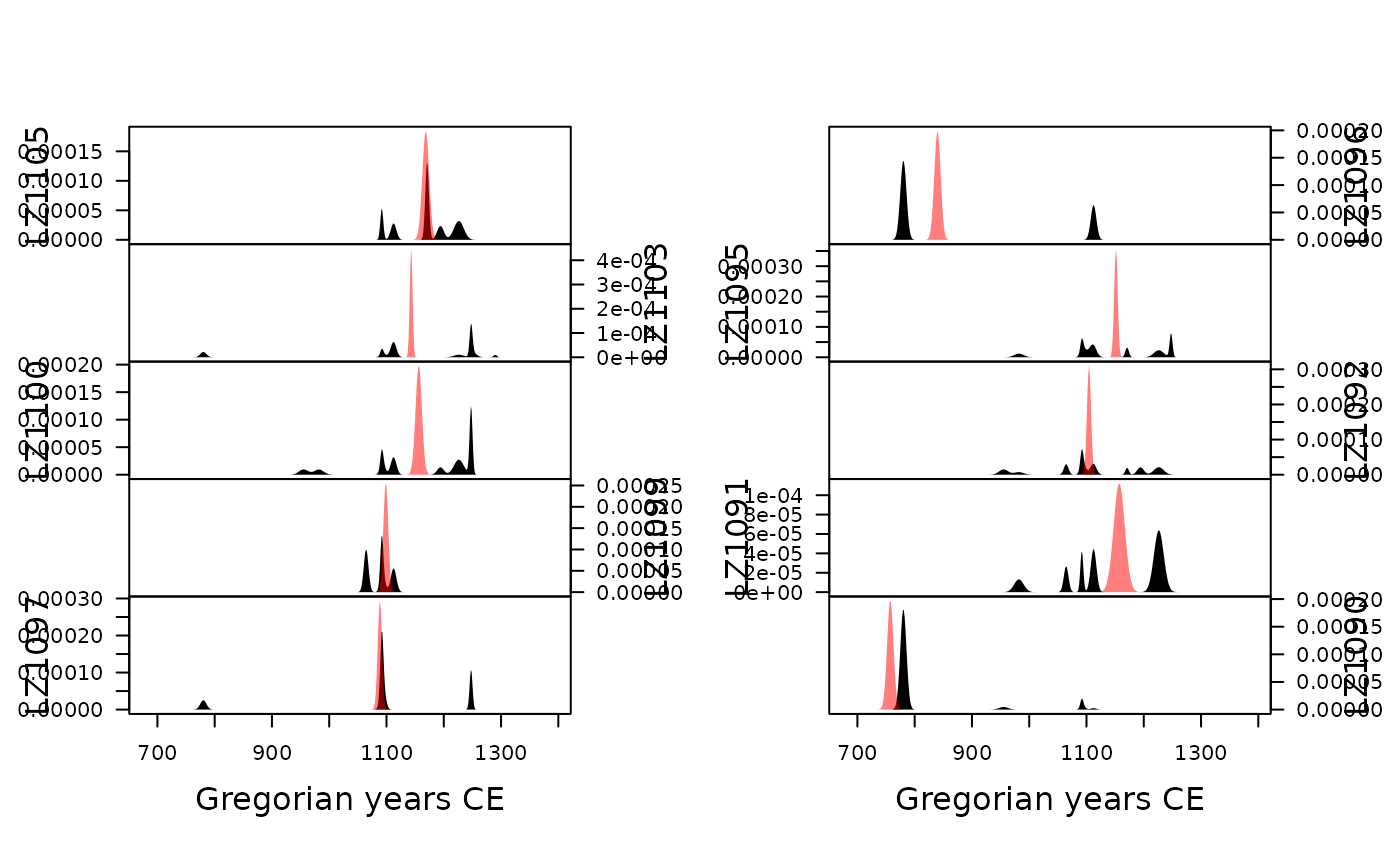
Event and Acccumulation Dates
plot() displays the probability estimate density curves of archaeological
assemblage dates (event and accumulation dates; Bellanger and Husi
2012). The event date is plotted as a line, while the accumulation date
is shown as a grey filled area.
The accumulation date can be displayed as a tempo plot (Dye 2016) or an activity plot (Philippe and Vibet 2020):
tempoA tempo plot estimates the cumulative occurrence of archaeological events, such as the slope of the plot directly reflects the pace of change.
activityAn activity plot displays the first derivative of the tempo plot.
References
Bellanger, L. & Husi, P. (2012). Statistical Tool for Dating and Interpreting Archaeological Contexts Using Pottery. Journal of Archaeological Science, 39(4), 777-790. doi:10.1016/j.jas.2011.06.031 .
Dye, T. S. (2016). Long-Term Rhythms in the Development of Hawaiian Social Stratification. Journal of Archaeological Science, 71, 1-9. doi:10.1016/j.jas.2016.05.006 .
Philippe, A. & Vibet, M.-A. (2020). Analysis of Archaeological Phases Using the R Package ArchaeoPhases. Journal of Statistical Software, Code Snippets, 93(1), 1-25. doi:10.18637/jss.v093.c01 .
See also
Other event date tools:
density_event(),
event(),
model_event,
predict_event(),
resample_event
Examples
## Data from Peeples and Schachner 2012
data("zuni", package = "folio")

## Assume that some assemblages are reliably dated (this is NOT a real example)
zuni_dates <- c(
  LZ0569 = 1097, LZ0279 = 1119, CS16 = 1328, LZ0066 = 1111,
  LZ0852 = 1216, LZ1209 = 1251, CS144 = 1262, LZ0563 = 1206,
  LZ0329 = 1076, LZ0005Q = 859, LZ0322 = 1109, LZ0067 = 863,
  LZ0578 = 1180, LZ0227 = 1104, LZ0610 = 1074
)

## Model the event and accumulation date for each assemblage
model <- event(zuni, zuni_dates, rank = 10)
plot(model, select = 1:10, event = TRUE, flip = TRUE)