Fits a date event model.
Usage
event(object, dates, ...)

# S4 method for class 'data.frame,numeric'
event(object, dates, rank = NULL, sup_row = NULL, calendar = CE(), ...)

# S4 method for class 'matrix,numeric'
event(
  object,
  dates,
  calendar = CE(),
  rank = NULL,
  sup_row = NULL,
  total = 5,
  verbose = getOption("kairos.verbose"),
  ...
)
Arguments
- object
A \(m \times p\)
numericmatrixordata.frameof count data (absolute frequencies giving the number of individuals for each category, i.e. a contingency table). Adata.framewill be coerced to anumericmatrixviadata.matrix().- dates
A
numericvector of dates. If named, the names must match the row names ofobject.- ...
Further arguments to be passed to internal methods.
- rank
An
integerspecifying the number of CA factorial components to be use for linear model fitting (see details). IfNULL(the default), axes corresponding to at least 60% of the inertia will be used.- sup_row
A
numericorlogicalvector specifying the indices of the supplementary rows.- calendar
An
aion::TimeScaleobject specifying the calendar ofdates(seeaion::calendar()). Defaults to Gregorian Common Era.- total
A length-one
numericvector specifying the minimum total of a row/column. Rows/columns whose total is less than this value will be omitted from the analysis.- verbose
A
logicalscalar: should R report extra information on progress?
Value
An EventDate object.
Details
This is an implementation of the chronological modeling method proposed by Bellanger and Husi (2012, 2013).
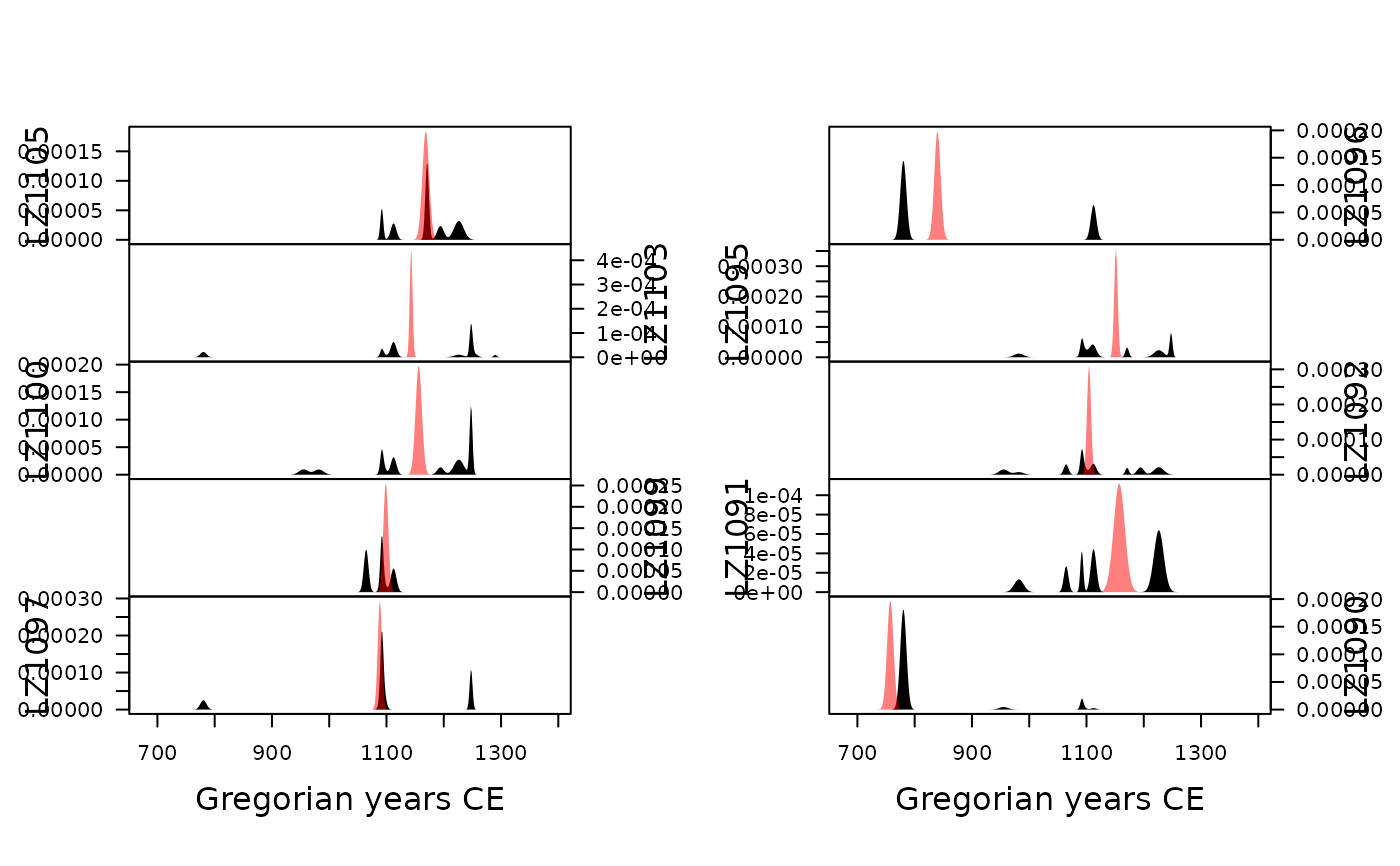
Event and accumulation dates are density estimates of the occupation and duration of an archaeological site (Bellanger and Husi 2012, 2013). The event date is an estimation of the terminus post-quem of an archaeological assemblage. The accumulation date represents the "chronological profile" of the assemblage. According to Bellanger and Husi (2012), accumulation date can be interpreted "at best [...] as a formation process reflecting the duration or succession of events on the scale of archaeological time, and at worst, as imprecise dating due to contamination of the context by residual or intrusive material." In other words, accumulation dates estimate occurrence of archaeological events and rhythms of the long term.
Dates are converted to rata die before any computation.
This method relies on strong archaeological and statistical assumptions
(see vignette("event")).
References
Bellanger, L. & Husi, P. (2013). Mesurer et modéliser le temps inscrit dans la matière à partir d'une source matérielle : la céramique médiévale. In Mesure et Histoire Médiévale. Histoire ancienne et médiévale. Paris: Publication de la Sorbonne, p. 119-134.
Bellanger, L. & Husi, P. (2012). Statistical Tool for Dating and Interpreting Archaeological Contexts Using Pottery. Journal of Archaeological Science, 39(4), 777-790. doi:10.1016/j.jas.2011.06.031 .
Bellanger, L., Tomassone, R. & Husi, P. (2008). A Statistical Approach for Dating Archaeological Contexts. Journal of Data Science, 6, 135-154.
Bellanger, L., Husi, P. & Tomassone, R. (2006). Une approche statistique pour la datation de contextes archéologiques. Revue de Statistique Appliquée, 54(2), 65-81.
Bellanger, L., Husi, P. & Tomassone, R. (2006). Statistical Aspects of Pottery Quantification for the Dating of Some Archaeological Contexts. Archaeometry, 48(1), 169-183. doi:10.1111/j.1475-4754.2006.00249.x .
Poblome, J. & Groenen, P. J. F. (2003). Constrained Correspondence Analysis for Seriation of Sagalassos Tablewares. In Doerr, M. & Apostolis, S. (eds.), The Digital Heritage of Archaeology. Athens: Hellenic Ministry of Culture.
See also
plot(), bootstrap(),
jackknife()
Other event date tools:
density_event(),
model_event,
predict_event()
Other dating methods:
mcd()
Examples
## Data from Peeples and Schachner 2012
data("zuni", package = "folio")

## Assume that some assemblages are reliably dated (this is NOT a real example)
zuni_dates <- c(
  LZ0569 = 1097, LZ0279 = 1119, CS16 = 1328, LZ0066 = 1111,
  LZ0852 = 1216, LZ1209 = 1251, CS144 = 1262, LZ0563 = 1206,
  LZ0329 = 1076, LZ0005Q = 859, LZ0322 = 1109, LZ0067 = 863,
  LZ0578 = 1180, LZ0227 = 1104, LZ0610 = 1074
)

## Model the event and accumulation date for each assemblage
model <- event(zuni, zuni_dates, rank = 10)
plot(model, select = 1:10, event = TRUE, flip = TRUE)