Shows colors in a plot with different types of simulated color blindness.
Arguments
- x
A
charactervector of colors.
Value
plot_scheme_colourblind() is called for its side-effects: it results in a
graphic being displayed (invisibly returns x).
See also
Other diagnostic tools:
change(),
compare(),
plot.color_scheme(),
plot_map(),
plot_scheme(),
plot_tiles()
Examples
if (requireNamespace("spacesXYZ", quietly = TRUE)) {
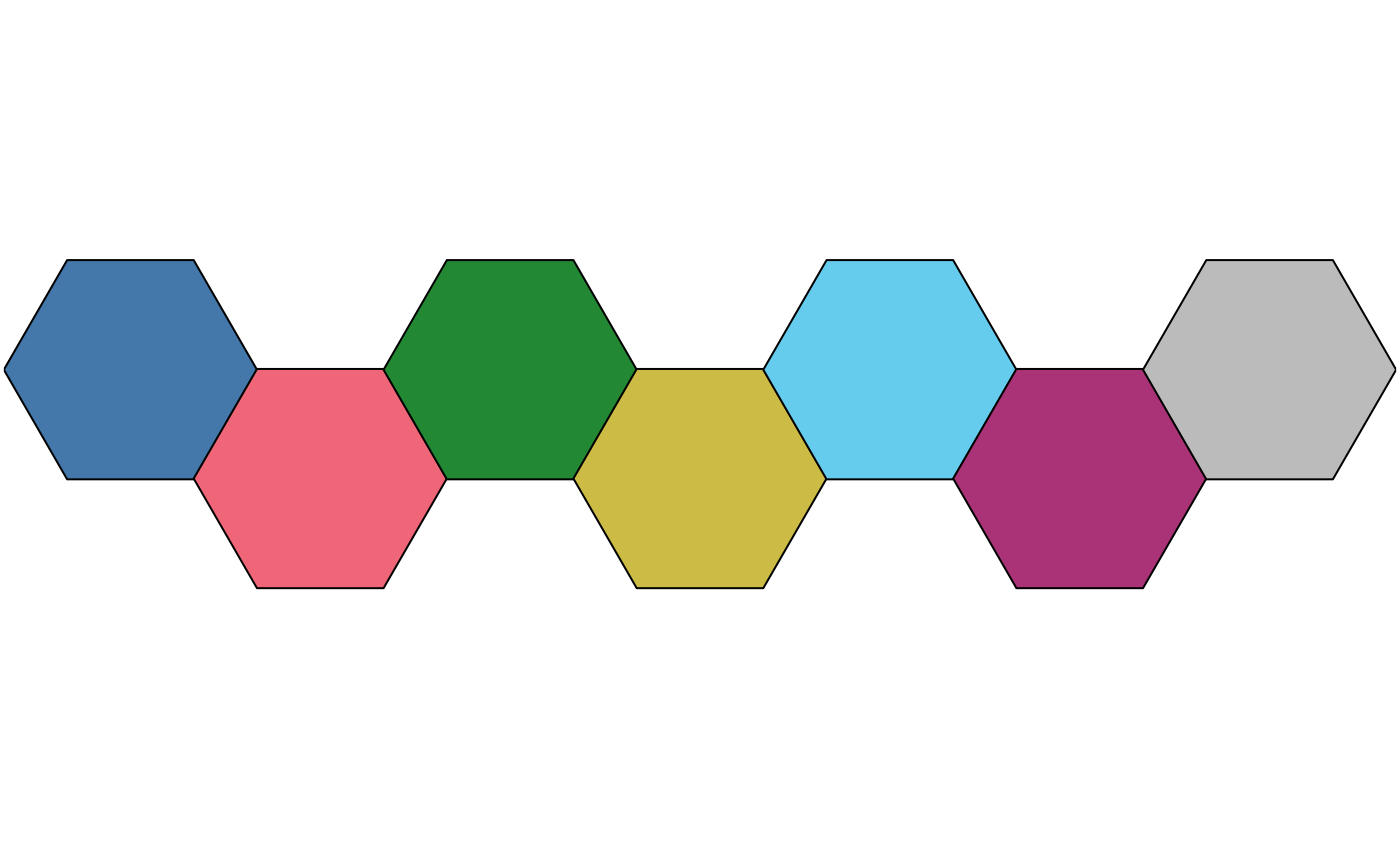
## Trichromat
pal <- colour("bright")
plot_scheme(pal(7))
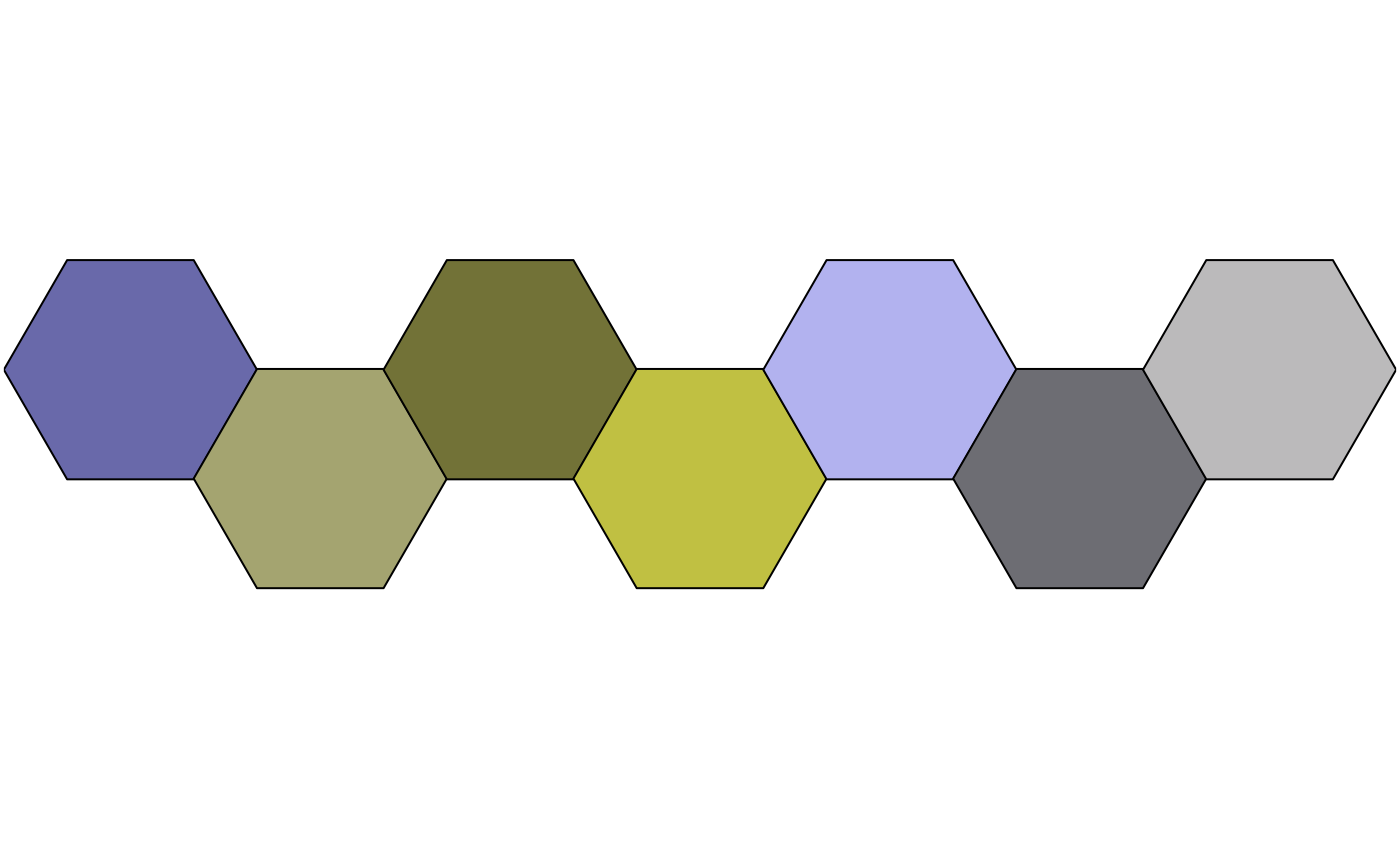
## Deuteranopia
deu <- change(pal, mode = "deuteranopia")
plot_scheme(deu(7))
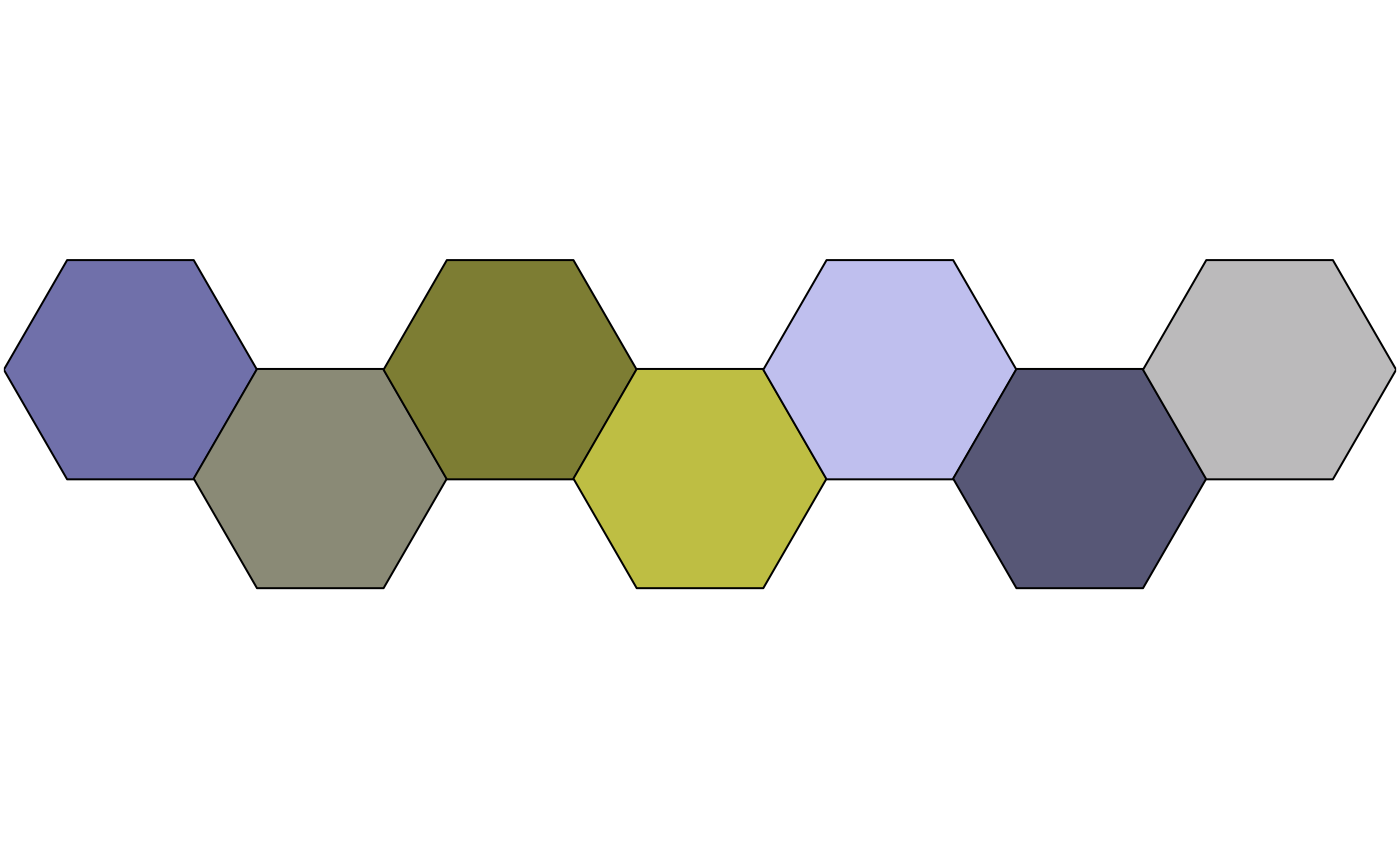
## Protanopia
pro <- change(pal, mode = "protanopia")
plot_scheme(pro(7))
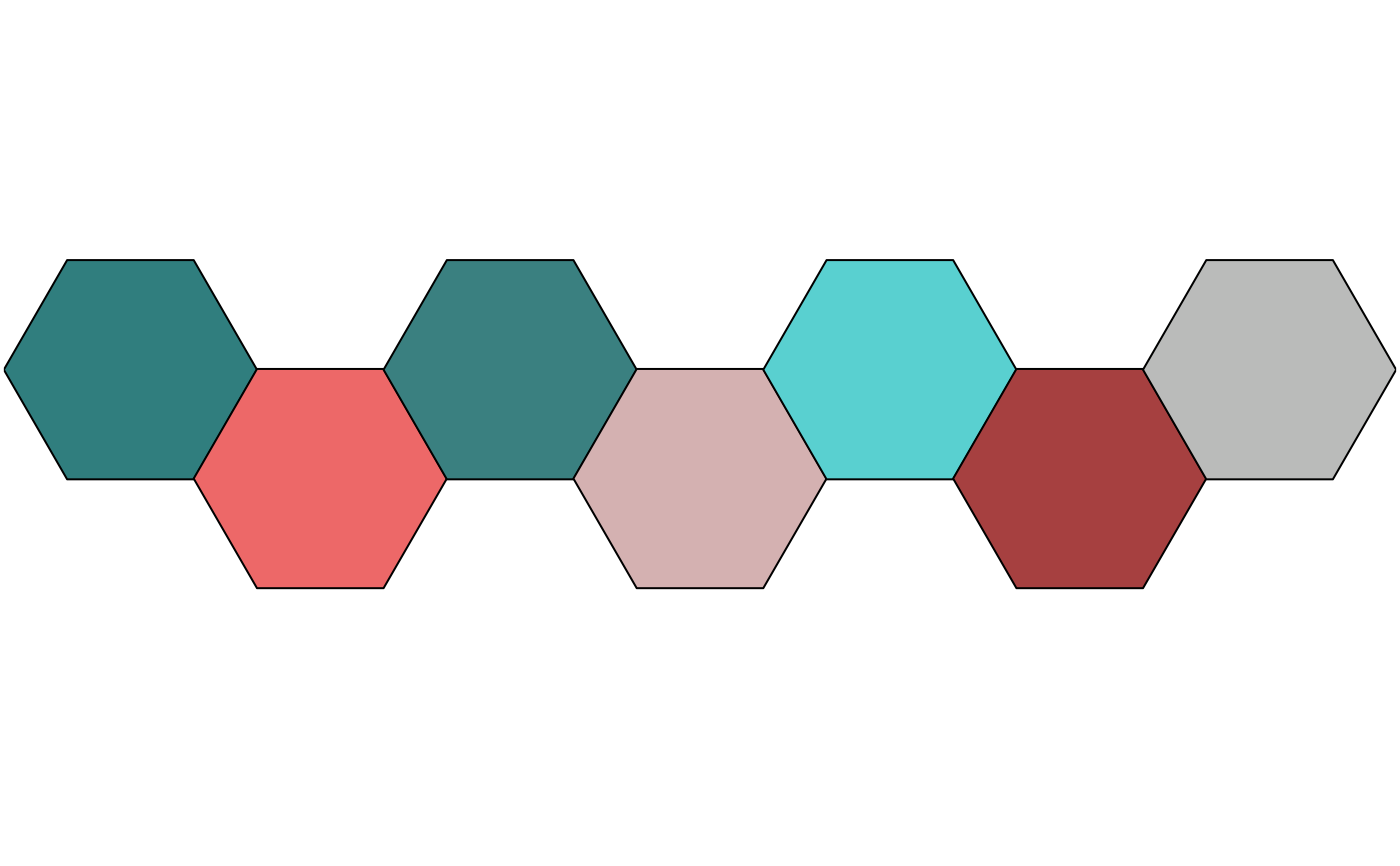
## Tritanopia
tri <- change(pal, mode = "tritanopia")
plot_scheme(tri(7))
## Achromatopsia
ach <- change(pal, mode = "achromatopsia")
plot_scheme(ach(7))
## Plot simulated color blindness
plot_scheme_colorblind(pal(7))
}