Geologic Timescale Color Scheme for ggplot2 and ggraph
Source:R/scale_colour_science.R
scale_stratigraphy.RdProvides the geologic timescale color scheme.
Usage
scale_colour_stratigraphy(..., lang = "en", aesthetics = "colour")

scale_color_stratigraphy(..., lang = "en", aesthetics = "colour")

scale_fill_stratigraphy(..., lang = "en", aesthetics = "fill")

scale_edge_colour_stratigraphy(..., lang = "en")

scale_edge_color_stratigraphy(..., lang = "en")

scale_edge_fill_stratigraphy(..., lang = "en")
Arguments
- ...
Arguments passed on to
ggplot2::discrete_scale().- lang
A
characterstring specifying the language for the color names (see details). It must be one of "en" (english, the default), "fr" (french) orNULL. If notNULL, the values will be matched based on the color names.- aesthetics
A
characterstring or vector of character strings listing the name(s) of the aesthetic(s) that this scale works with.
Value
A discrete scale.
See also
Other themed color schemes:
scale_colour_land(),
scale_colour_soil()
Other qualitative color schemes:
scale_colour_land(),
scale_colour_soil(),
scale_okabeito_discrete,
scale_tol_bright,
scale_tol_dark,
scale_tol_discreterainbow,
scale_tol_highcontrast,
scale_tol_light,
scale_tol_mediumcontrast,
scale_tol_muted,
scale_tol_pale,
scale_tol_vibrant
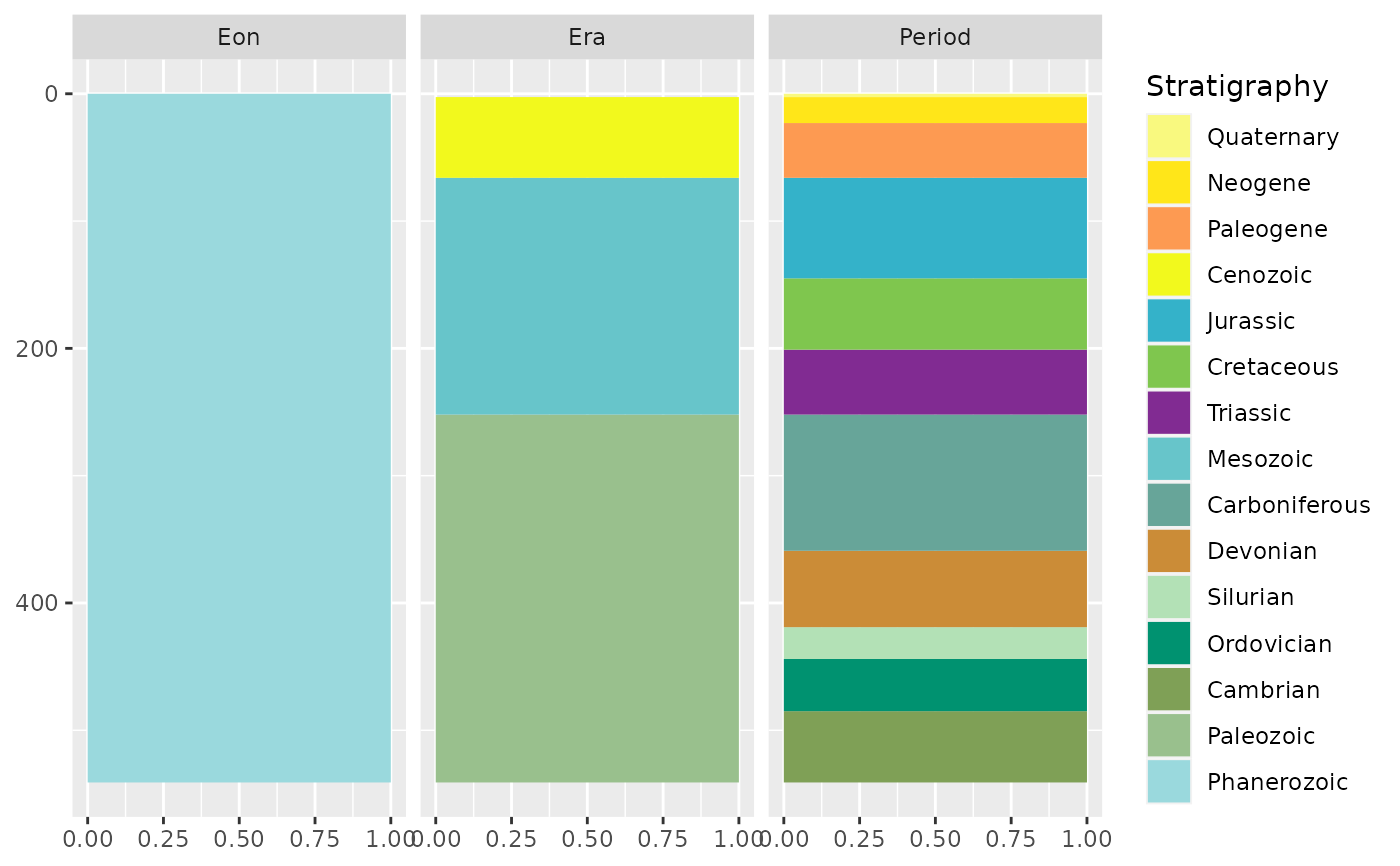
Examples
library(ggplot2)

strati <- data.frame(
  name = c("Phanerozoic", "Paleozoic", "Cambrian", "Ordovician", "Silurian",
           "Devonian", "Carboniferous", "Mesozoic", "Triassic", "Cretaceous",
           "Jurassic", "Cenozoic", "Paleogene", "Neogene", "Quaternary"),
  type = c("Eon", "Era", "Period", "Period", "Period", "Period", "Period",
           "Era", "Period", "Period", "Period", "Era", "Period", "Period",
           "Period"),
  start = c(541, 541, 541, 485, 444, 419, 359,
            252, 252, 201, 145, 66, 66, 23, 2.6),
  end = c(0, 252, 485, 444, 419, 359, 252,
          66, 201, 145, 66, 2.6, 23, 2.6, 0)
)

## Keep chronological order in the legend
strati$name <- factor(strati$name, levels = rev(unique(strati$name)),
                      ordered = TRUE)

## Workaround: use `limits = force` to remove unused values
ggplot2::ggplot(strati) +
  ggplot2::geom_rect(ggplot2::aes(xmin = rep(0, 15), xmax = rep(1, 15),
                                  ymin = start, ymax = end, fill = name)) +
  ggplot2::scale_y_reverse() +
  ggplot2::facet_grid(. ~ type) +
  scale_fill_stratigraphy(name = "Stratigraphy", limits = force)