Paul Tol's vibrant Discrete Color Scheme
Usage
scale_colour_vibrant(..., reverse = FALSE, aesthetics = "colour")

scale_color_vibrant(..., reverse = FALSE, aesthetics = "colour")

scale_fill_vibrant(..., reverse = FALSE, aesthetics = "fill")

scale_edge_colour_vibrant(..., reverse = FALSE, aesthetics = "edge_colour")

scale_edge_color_vibrant(..., reverse = FALSE, aesthetics = "edge_colour")

scale_edge_fill_vibrant(..., reverse = FALSE, aesthetics = "edge_fill")
Arguments
- ...
Arguments passed to
ggplot2::discrete_scale().- reverse
A
logicalscalar. Should the resulting vector of colors be reversed?- aesthetics
A
characterstring or vector of character strings listing the name(s) of the aesthetic(s) that this scale works with.
Value
A discrete scale.
Qualitative Color Schemes
The qualitative color schemes are used as given (no interpolation): colors are picked up to the maximum number of supported values.
| Palette | Max. |
bright | 7 |
highcontrast | 3 |
vibrant | 7 |
muted | 9 |
mediumcontrast | 6 |
pale | 6 |
dark | 6 |
light | 9 |
According to Paul Tol's technical note, the bright, highcontrast,
vibrant and muted color schemes are color-blind safe. The
mediumcontrast color scheme is designed for situations needing color
pairs.
The light color scheme is reasonably distinct for both normal or
colorblind vision and is intended to fill labeled cells.
The pale and dark schemes are not very distinct in either normal or
colorblind vision and should be used as a text background or to highlight
a cell in a table.
Refer to the original document for details about the recommended uses (see references)
References
Tol, P. (2021). Colour Schemes. SRON. Technical Note No. SRON/EPS/TN/09-002, issue 3.2. URL: https://sronpersonalpages.nl/~pault/data/colourschemes.pdf
See also
Other qualitative color schemes:
scale_colour_land(),
scale_colour_soil(),
scale_colour_stratigraphy(),
scale_okabeito_discrete,
scale_tol_bright,
scale_tol_dark,
scale_tol_discreterainbow,
scale_tol_highcontrast,
scale_tol_light,
scale_tol_mediumcontrast,
scale_tol_muted,
scale_tol_pale
Other Paul Tol's color schemes:
scale_tol_BuRd,
scale_tol_PRGn,
scale_tol_YlOrBr,
scale_tol_bright,
scale_tol_dark,
scale_tol_discreterainbow,
scale_tol_highcontrast,
scale_tol_incandescent,
scale_tol_iridescent,
scale_tol_light,
scale_tol_mediumcontrast,
scale_tol_muted,
scale_tol_nightfall,
scale_tol_pale,
scale_tol_smoothrainbow,
scale_tol_sunset
Examples
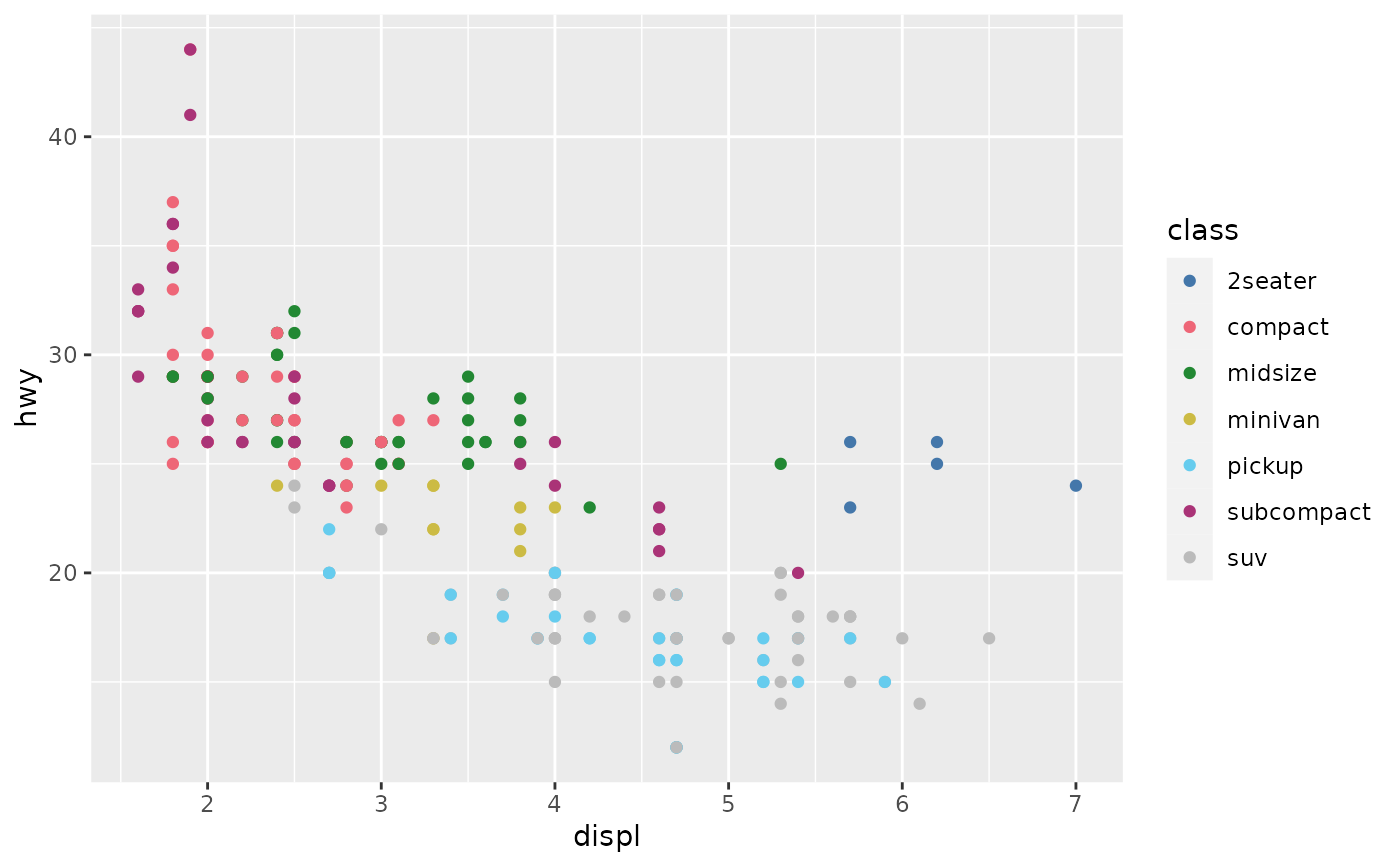
data(mpg, package = "ggplot2")
ggplot2::ggplot(mpg, ggplot2::aes(displ, hwy, colour = class)) +
ggplot2::geom_point() +
scale_colour_bright()
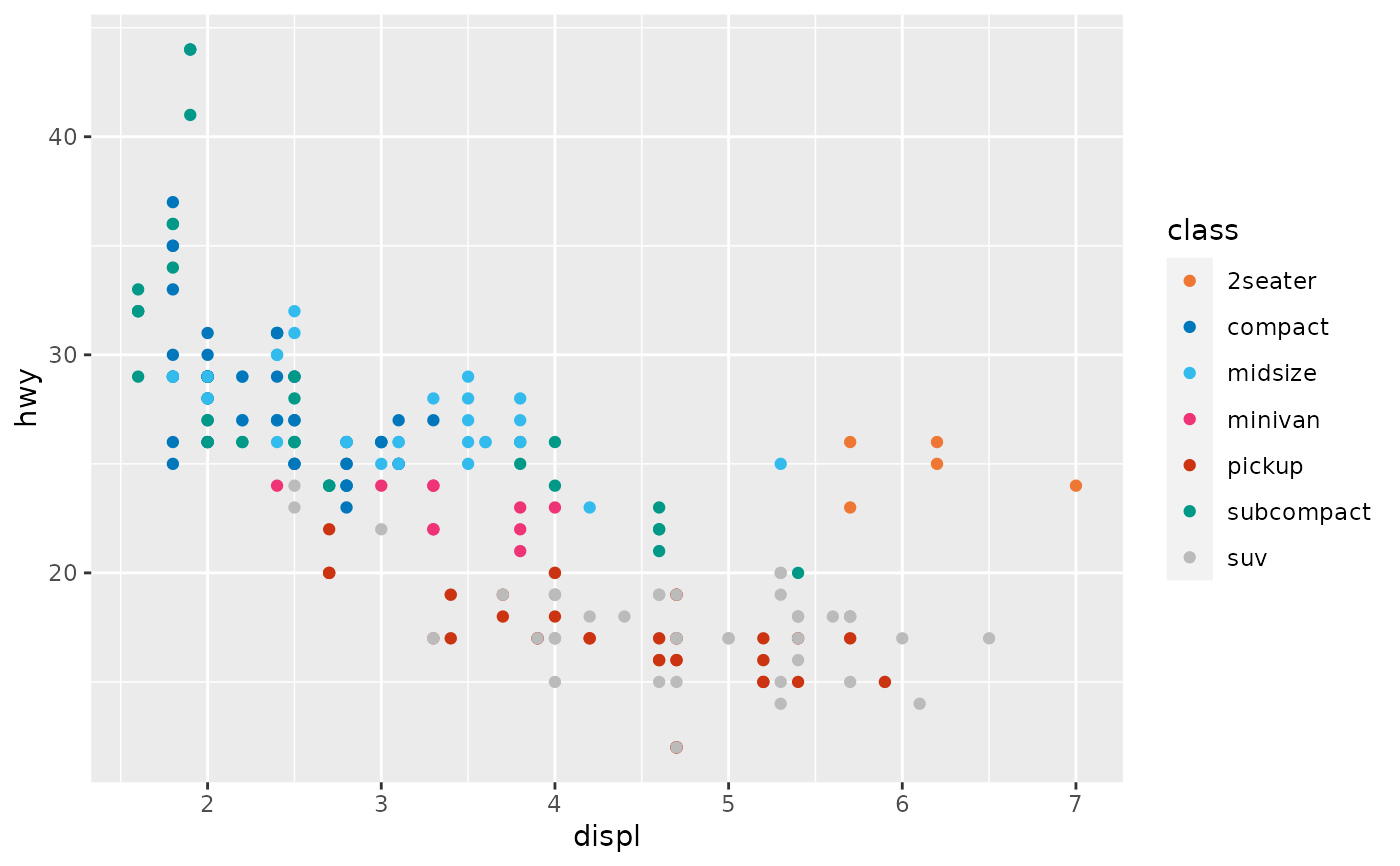
 ggplot2::ggplot(mpg, ggplot2::aes(displ, hwy, colour = class)) +
ggplot2::geom_point() +
scale_colour_vibrant()
ggplot2::ggplot(mpg, ggplot2::aes(displ, hwy, colour = class)) +
ggplot2::geom_point() +
scale_colour_vibrant()
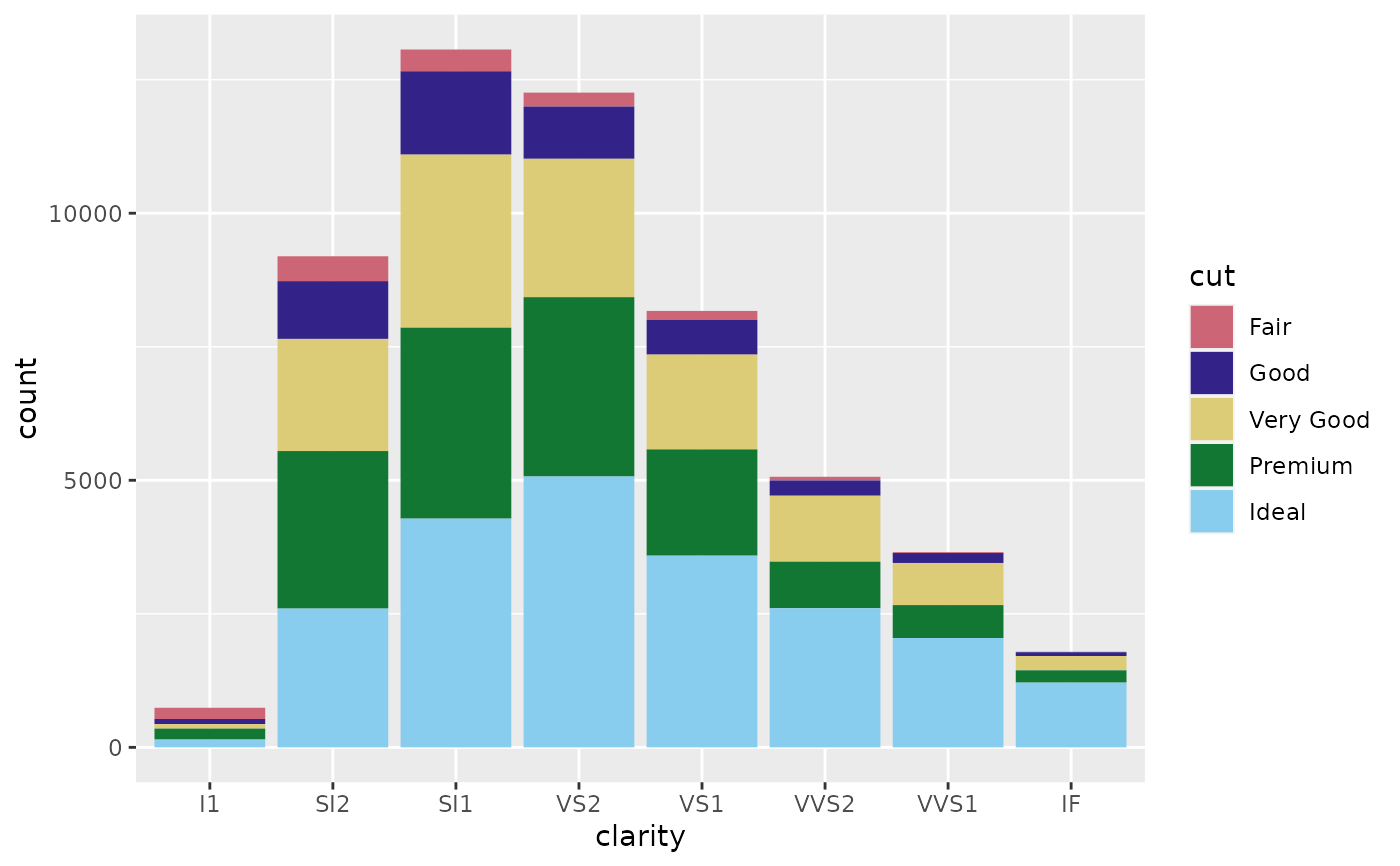
 data(diamonds, package = "ggplot2")
ggplot2::ggplot(diamonds, ggplot2::aes(clarity, fill = cut)) +
ggplot2::geom_bar() +
scale_fill_muted()
data(diamonds, package = "ggplot2")
ggplot2::ggplot(diamonds, ggplot2::aes(clarity, fill = cut)) +
ggplot2::geom_bar() +
scale_fill_muted()