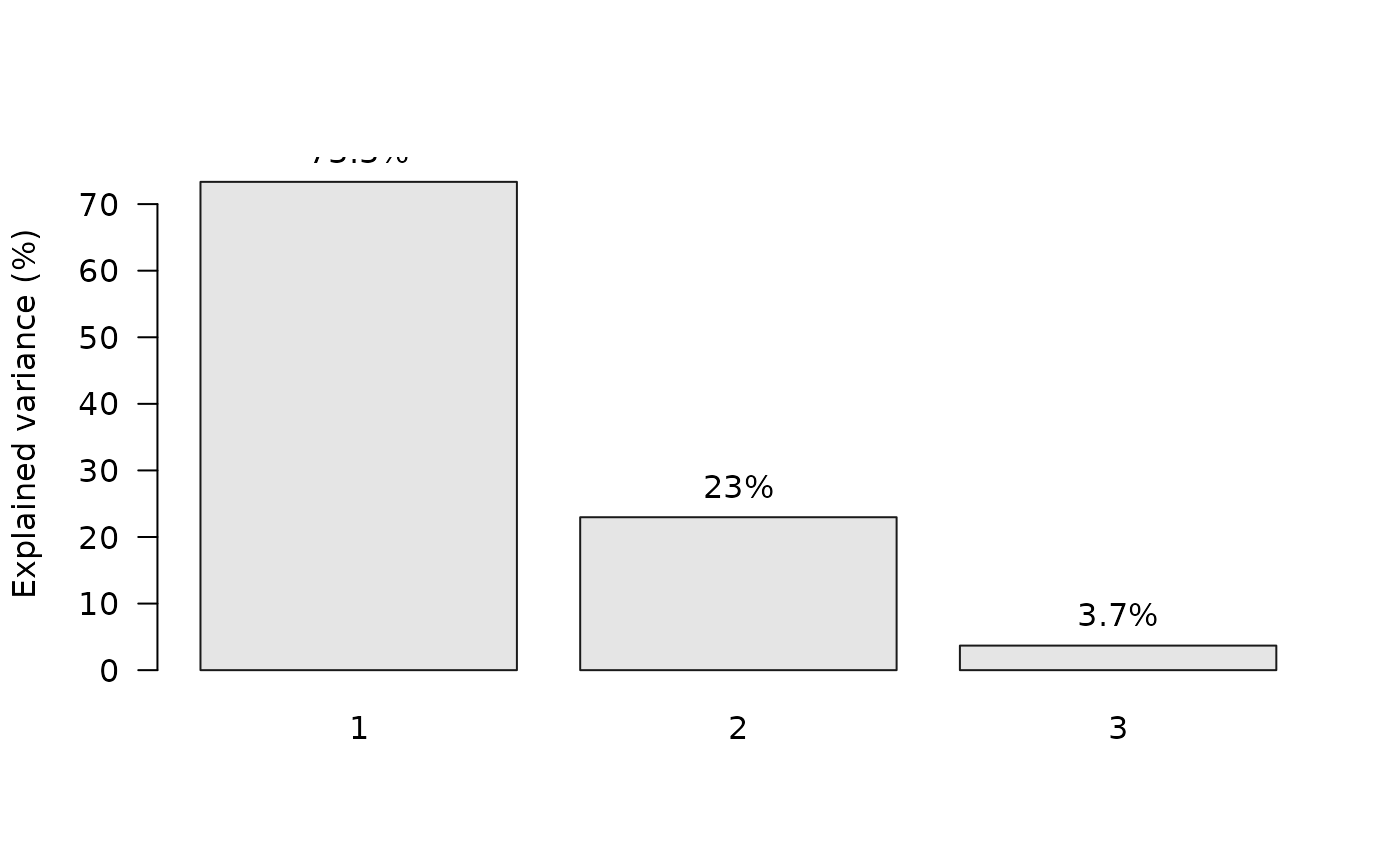
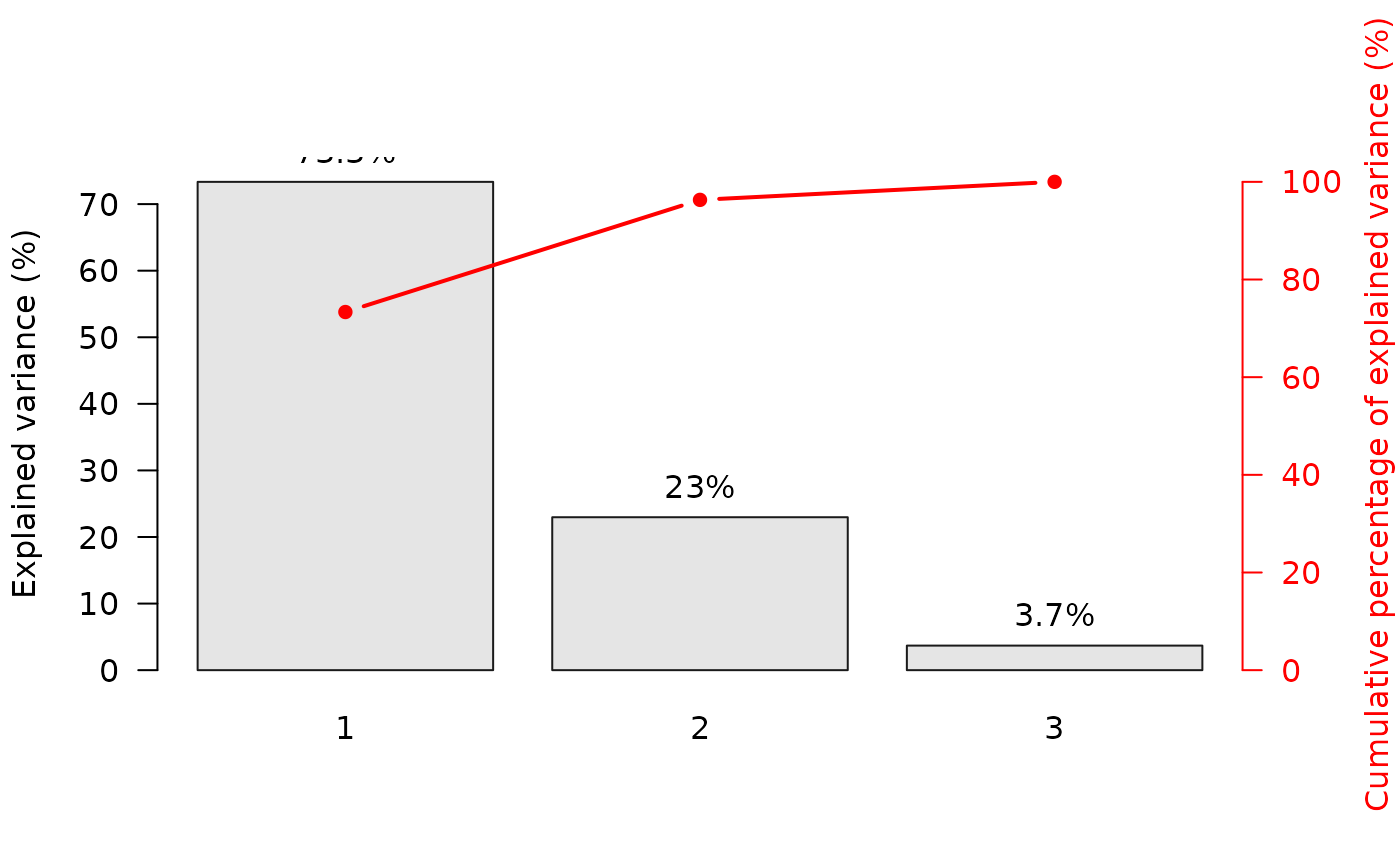
Plot eigenvalues (scree plot) or variances histogram.
Usage
# S4 method for class 'MultivariateAnalysis'
screeplot(
  x,
  ...,
  eigenvalues = FALSE,
  cumulative = FALSE,
  labels = TRUE,
  limit = 10,
  col = "grey90",
  border = "grey10",
  col.cumulative = "red",
  lty.cumulative = "solid",
  lwd.cumulative = 2
)

# S4 method for class 'PCOA'
screeplot(
  x,
  ...,
  labels = FALSE,
  limit = NULL,
  col = "grey90",
  border = "grey10"
)
Arguments
- x
- ...
Extra parameters to be passed to
graphics::barplot().- eigenvalues
A
logicalscalar: should the eigenvalues be plotted instead of variance/inertia?- cumulative
A
logicalscalar: should the cumulative percentages of variance be plotted?- labels
A
logicalscalar: should text labels be drawn on top of bars?- limit
An
integerspecifying the number of top elements to be displayed.- col, border
A
characterstring specifying the bars infilling and border colors.- col.cumulative
A specification for the line color.
- lty.cumulative
A specification for the line type.
- lwd.cumulative
A specification for the line width.
Value
screeplot() is called for its side-effects: it results in a graphic
being displayed. Invisibly returns x.
See also
Other plot methods:
biplot(),
plot(),
viz_contributions(),
viz_individuals(),
viz_variables()