Computes and draws contour lines.
Usage
ternary_contour(x, y, z, ...)

# S4 method for class 'numeric,numeric,numeric'
ternary_contour(
  x,
  y,
  z,
  value,
  n = 50,
  nlevels = 10,
  levels = pretty(range(value, na.rm = TRUE), nlevels),
  ilr = TRUE,
  method = "linear",
  extrapolate = FALSE,
  palette = function(i) grDevices::hcl.colors(i, "YlOrRd", rev = TRUE),
  ...
)

# S4 method for class 'ANY,missing,missing'
ternary_contour(
  x,
  value,
  n = 50,
  nlevels = 10,
  levels = pretty(range(value, na.rm = TRUE), nlevels),
  ilr = TRUE,
  method = "linear",
  extrapolate = FALSE,
  palette = function(i) grDevices::hcl.colors(i, "YlOrRd", rev = TRUE),
  ...
)
Arguments
- x, y, z
A
numericvector giving the x, y and z ternary coordinates of a set of points. Ifyandzare missing, an attempt is made to interpretxin a suitable way (seegrDevices::xyz.coords()).- ...
Further arguments to be passed to
ternary_lines().- value
A
numericvector giving the values to be interpolated.- n
A length-one
numericspecifying the number of grid points.- nlevels
A length-one
numericvector specifying the number of contour levels desired. Only used iflevelsisNULL.- levels
A
numericvector of levels at which to draw contour lines.- ilr
A
logicalscalar: should interpolation be computed in ILR space? IfFALSE, interpolation is computed in Cartesian space.- method
A
characterstring: specifying the method for interpolation (seeinterp::interp()).- extrapolate
A
logicalscalar: should extrapolation be used outside of the convex hull determined by the data points (seeinterp::interp())?- palette
A color palette
functionthat takes a single integer argument (the number of levels) and returns a vector of colors.
Value
ternary_contour() is called it for its side-effects.
Invisibly returns a list with elements levels (the contour levels) and
colors (the contour colors) that can be used for a legend.
Details
Contour are computed from a bivariate interpolation onto a grid, after an isometric log ratio transformation of the original data.
See also
interp::interp(), grDevices::contourLines()
Other statistics:
ternary_density(),
ternary_ellipse(),
ternary_hull(),
ternary_mean(),
ternary_pca()
Examples
## Add density
## Data from Aitchison 1986
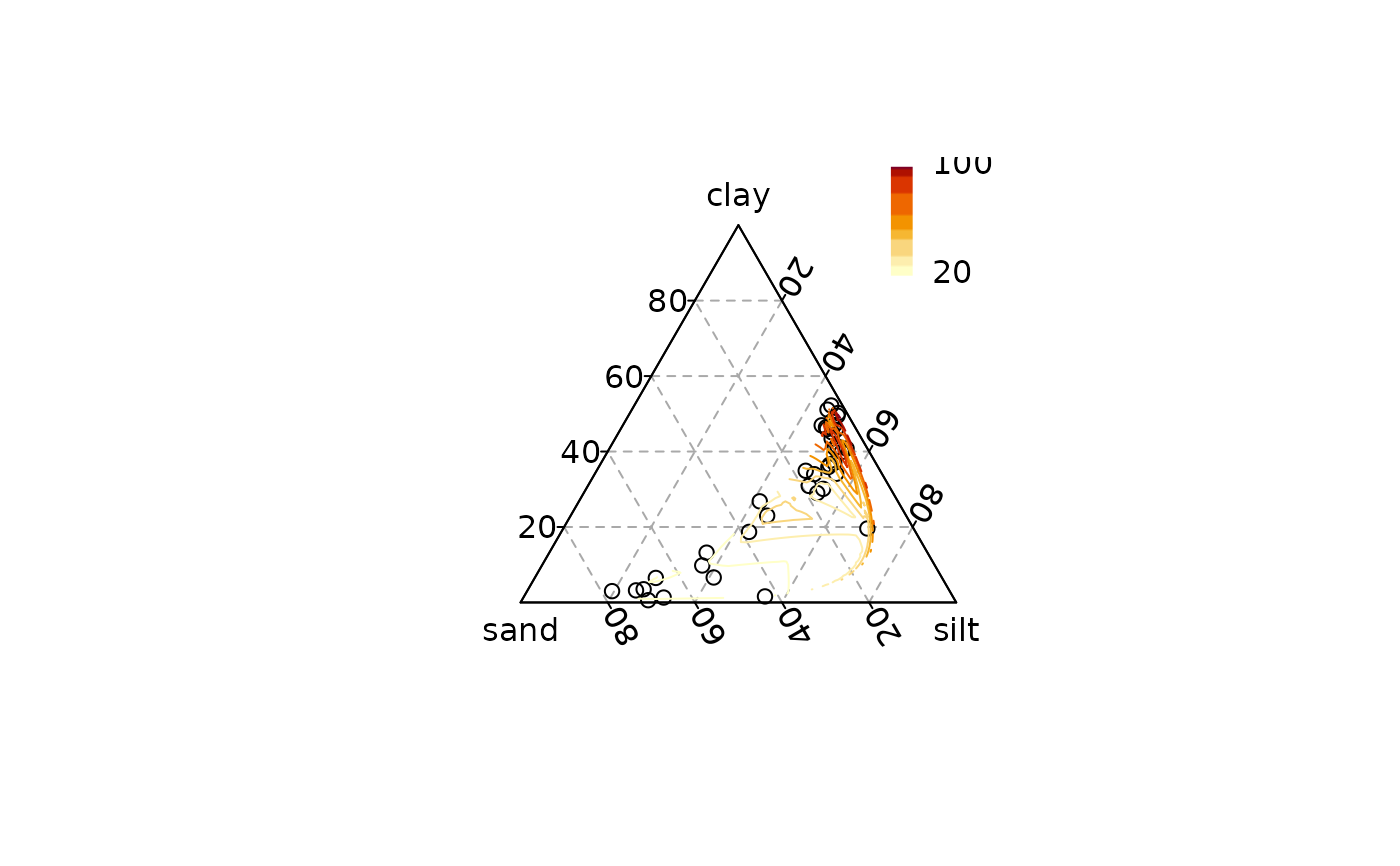
ternary_plot(arctic, panel.first = ternary_grid())
levels <- ternary_contour(arctic, value = arctic$depth, n = 100, nlevels = 10)
## Add a legend
legend_image <- grDevices::as.raster(rev(levels$colors))
graphics::rasterImage(legend_image, 0.85, 0.75, 0.9, 1)
graphics::text(x = 0.9, y = c(0.75, 1), labels = range(levels$levels), pos = 4)