
![]()
Overview
A convenient and reproducible toolkit for relative and absolute dating and analysis of chronological patterns. This package includes functions for chronological modeling and dating of archaeological assemblages from count data. It provides methods for matrix seriation. It also allows to compute time point estimates and density estimates of the occupation and duration of an archaeological site. kairos provides methods for:
- Matrix seriation:
seriate_rank()andseriate_average() - Mean ceramic date estimation (South 1977):
mcd() - Event and accumulation date estimation (Bellanger and Husi 2012):
event() - Aoristic analysis (Ratcliffe 2000):
aoristic() - Chronological apportioning (Roberts et al. 2012):
apportion()
tabula is a companion package to kairos that provides functions for visualization and analysis of archaeological count data.
To cite kairos in publications use:

  Frerebeau N (2024). _kairos: Analysis of Chronological Patterns from
  Archaeological Count Data_. Université Bordeaux Montaigne, Pessac,
  France. doi:10.5281/zenodo.5653896
  <https://doi.org/10.5281/zenodo.5653896>, R package version 2.1.0,
  <https://packages.tesselle.org/kairos/>.

A BibTeX entry for LaTeX users is

  @Manual{R-kairos,
    author = {Nicolas Frerebeau},
    title = {{kairos: Analysis of Chronological Patterns from Archaeological Count Data}},
    year = {2024},
    organization = {Université Bordeaux Montaigne},
    address = {Pessac, France},
    note = {R package version 2.1.0},
    url = {https://packages.tesselle.org/kairos/},
    doi = {10.5281/zenodo.5653896},
  }

This package is a part of the tesselle project
<https://www.tesselle.org>.
Installation
You can install the released version of kairos from CRAN with:
install.packages("kairos")And the development version from GitHub with:
# install.packages("remotes")
remotes::install_github("tesselle/kairos")
Usage
kairos v2.0 uses aion for internal date representation. Look at vignette("aion") before you start.
It assumes that you keep your data tidy: each variable (type/taxa) must be saved in its own column and each observation (sample/case) must be saved in its own row.
## Data from Husi 2022
data("loire", package = "folio")
keep <- c("Anjou", "Blésois", "Orléanais", "Haut-Poitou", "Touraine")
loire <- subset(loire, area %in% keep)

## Get time range
loire_range <- loire[, c("lower", "upper")]

## Calculate aoristic sum (weights) by group
ao <- aoristic(loire_range, step = 50, weight = TRUE, groups = loire$area)

## Plot
plot(ao, col = "grey")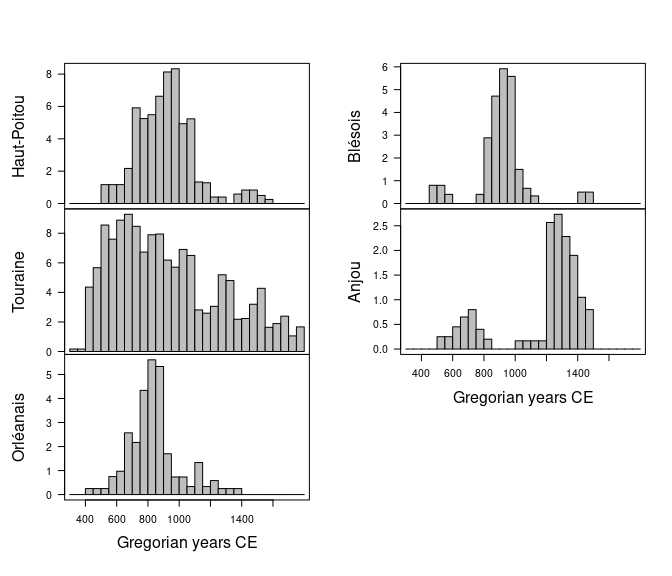
Contributing
Please note that the kairos project is released with a Contributor Code of Conduct. By contributing to this project, you agree to abide by its terms.