Plot Envelopes
Usage
viz_hull(x, ...)

viz_confidence(x, ...)

viz_tolerance(x, ...)

# S4 method for class 'MultivariateAnalysis'
viz_tolerance(
  x,
  ...,
  margin = 1,
  axes = c(1, 2),
  group = NULL,
  level = 0.95,
  color = NULL,
  fill = FALSE,
  symbol = FALSE
)

# S4 method for class 'BootstrapCA'
viz_tolerance(
  x,
  ...,
  margin = 1,
  axes = c(1, 2),
  level = 0.95,
  color = FALSE,
  fill = FALSE,
  symbol = FALSE
)

# S4 method for class 'MultivariateAnalysis'
viz_confidence(
  x,
  ...,
  margin = 1,
  axes = c(1, 2),
  group = NULL,
  level = 0.95,
  color = NULL,
  fill = FALSE,
  symbol = FALSE
)

# S4 method for class 'BootstrapCA'
viz_confidence(
  x,
  ...,
  margin = 1,
  axes = c(1, 2),
  level = 0.95,
  color = FALSE,
  fill = FALSE,
  symbol = FALSE
)

# S4 method for class 'MultivariateAnalysis'
viz_hull(
  x,
  ...,
  margin = 1,
  axes = c(1, 2),
  group = NULL,
  color = NULL,
  fill = FALSE,
  symbol = FALSE
)

# S4 method for class 'BootstrapCA'
viz_hull(
  x,
  ...,
  margin = 1,
  axes = c(1, 2),
  color = FALSE,
  fill = FALSE,
  symbol = FALSE
)
Arguments
- x
An object from which to wrap observations (a
CA,MCAorPCAobject).- ...
Further graphical parameters to be passed to
graphics::polygon().- margin
A length-one
numericvector giving the subscript which the data will be returned:1indicates individuals/rows (the default),2indicates variables/columns.- axes
A length-two
numericvector giving the dimensions for which to compute results.- group
A vector specifying the group an observation belongs to.
- level
A
numericvector specifying the confidence/tolerance level.- color
The colors for borders (will be mapped to
group). Ignored if set toFALSE. IfNULL, the default color scheme will be used.- fill
The background colors (will be mapped to
group). Ignored if set toFALSE.- symbol
A vector of symbols (will be mapped to
group). Ignored if set toFALSE.
Value
viz_*()is called for its side-effects: it results in a graphic being
displayed. Invisibly returns x.
See also
Other plot methods:
biplot(),
plot(),
screeplot(),
viz_contributions(),
viz_individuals(),
viz_variables(),
wrap
Examples
## Load data
data("iris")
## Compute principal components analysis
X <- pca(iris, scale = TRUE, sup_quali = "Species")
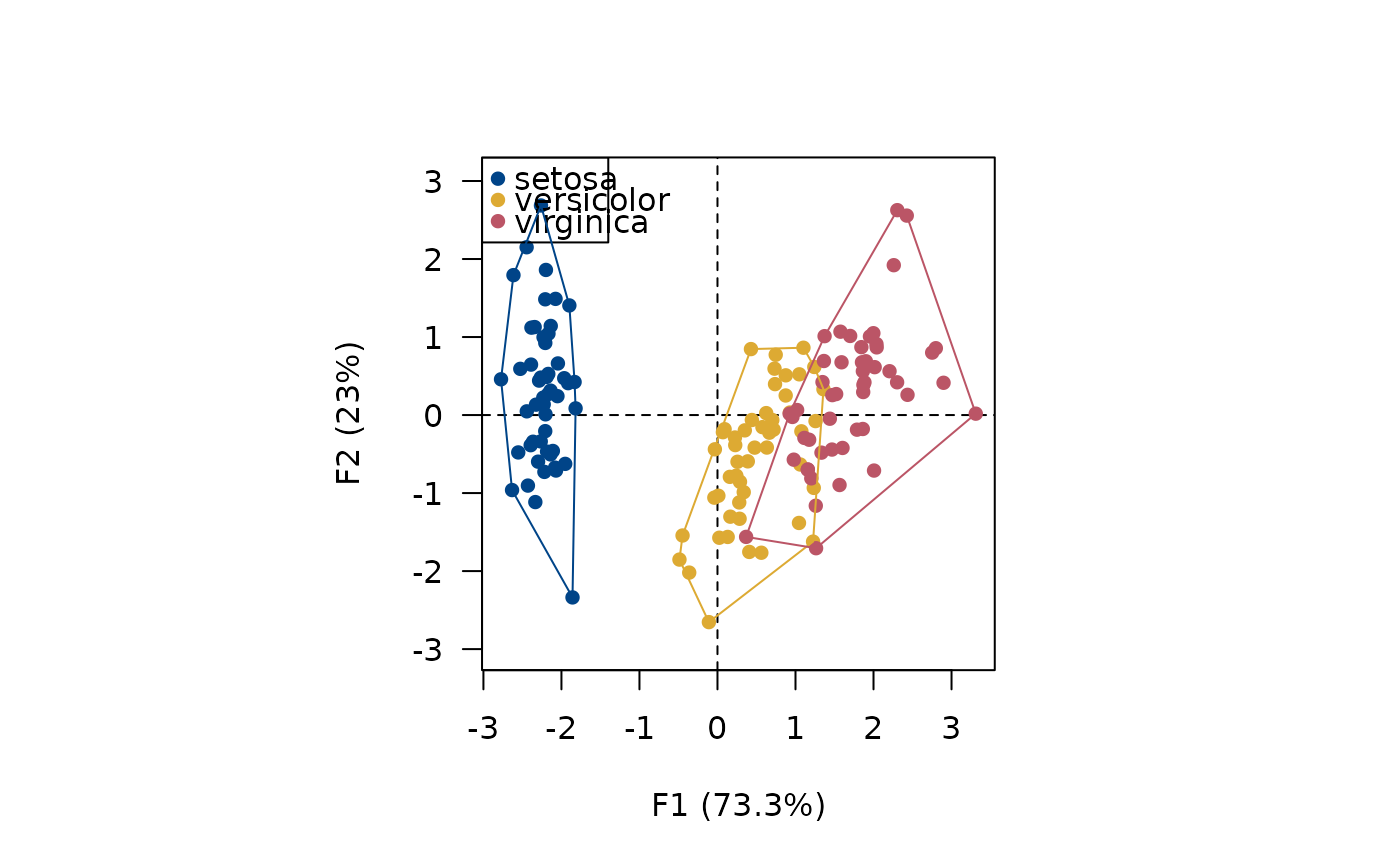
## Plot with convex hulls
col <- c("#004488", "#DDAA33", "#BB5566")
viz_rows(X, extra_quali = iris$Species, color = col)
viz_hull(X, group = iris$Species, color = col)
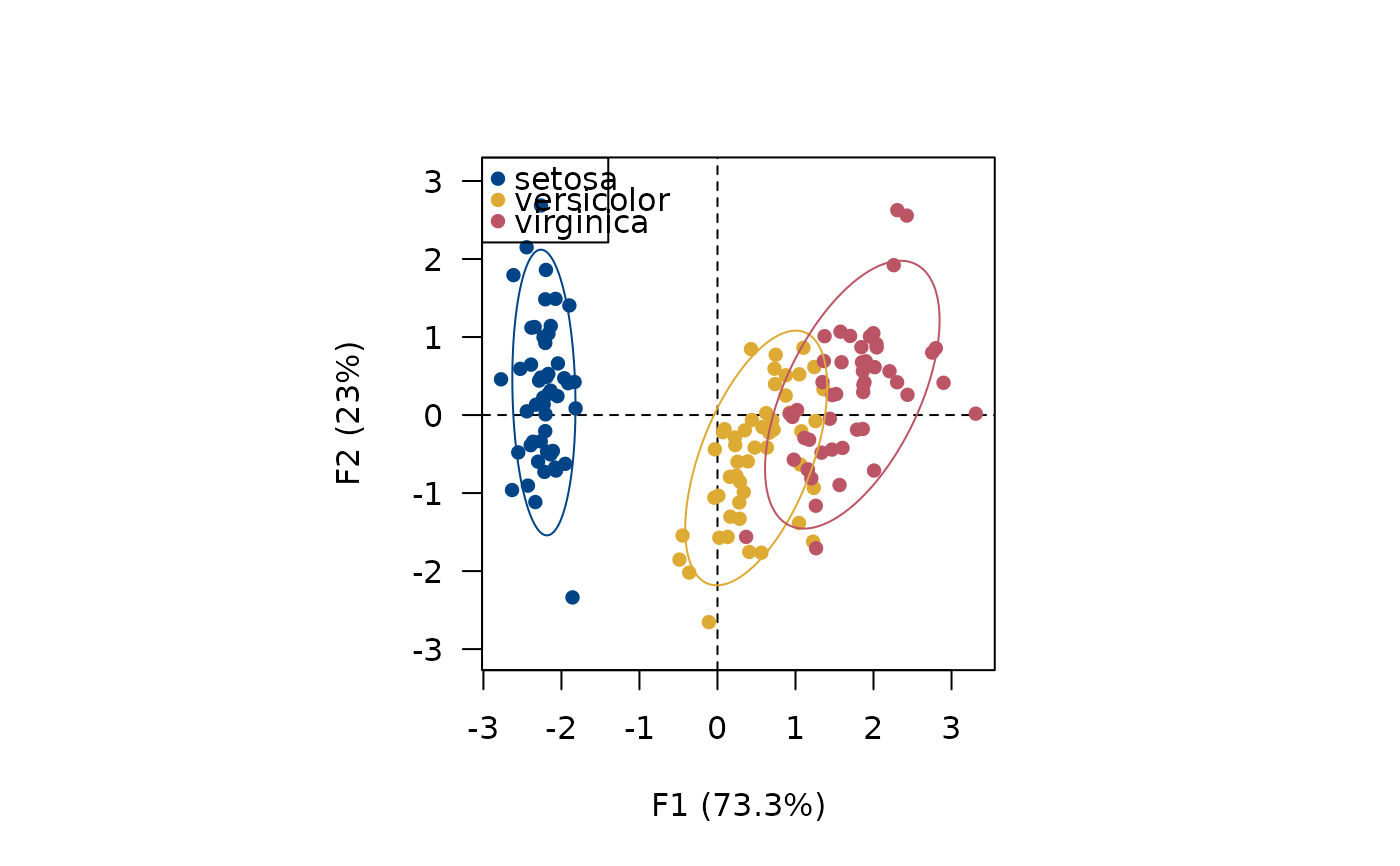
 ## Plot with tolerance ellipses
col <- c("#004488", "#DDAA33", "#BB5566")
viz_rows(X, extra_quali = iris$Species, color = col)
viz_tolerance(X, group = iris$Species, color = col)
## Plot with tolerance ellipses
col <- c("#004488", "#DDAA33", "#BB5566")
viz_rows(X, extra_quali = iris$Species, color = col)
viz_tolerance(X, group = iris$Species, color = col)