Maps values to colors.
Usage
palette_color_picker(
  scheme,
  domain = NULL,
  midpoint = NULL,
  ordered = FALSE,
  missing = NULL,
  ...
)

palette_colour_picker(
  scheme,
  domain = NULL,
  midpoint = NULL,
  ordered = FALSE,
  missing = NULL,
  ...
)
Arguments
- scheme
A
characterstring giving the name of the scheme to be used (seecolor()).- domain
A
numericrange or a vector of categorical data specifying the possible values that can be mapped.- midpoint
A length-one
numericvector specifying the mid-point of input range.- ordered
A
logicalscalar: should the levels be treated as already in the correct order?- missing
The color to return for
NAvalues.- ...
Further parameters to be passed to
color().
Value
A palette function that when called with a single argument returns
a character vector of colors.
Details
A wrapper around palette_color_continuous() and
palette_color_discrete().
See also
Other palettes:
palette_color_continuous(),
palette_color_discrete(),
palette_shape(),
palette_size
Examples
## Visualize a simple DEM model
## Distribution of elevation values
elevation <- hist(volcano)
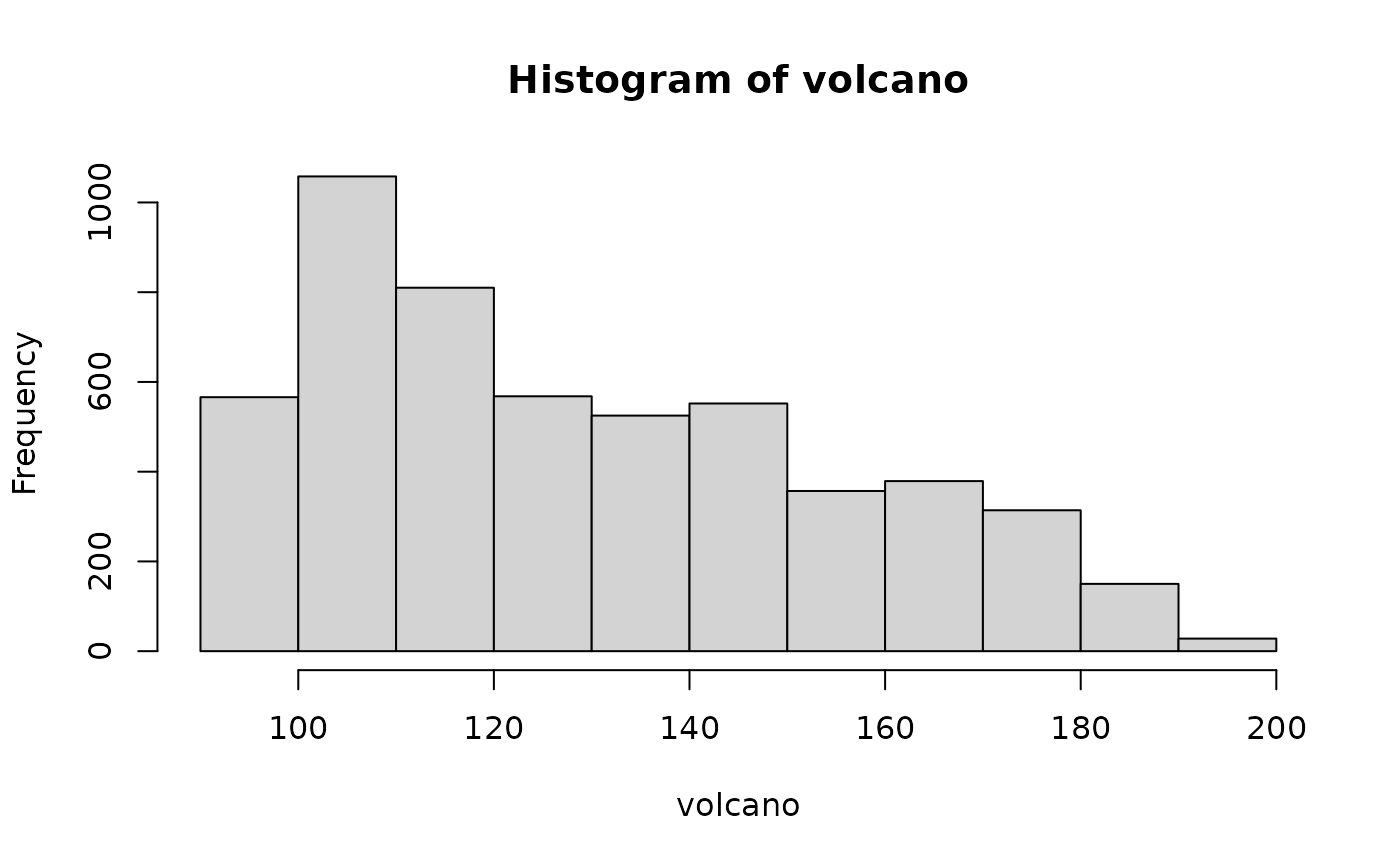 ## Where are breaks?
elevation$breaks
#> [1] 90 100 110 120 130 140 150 160 170 180 190 200
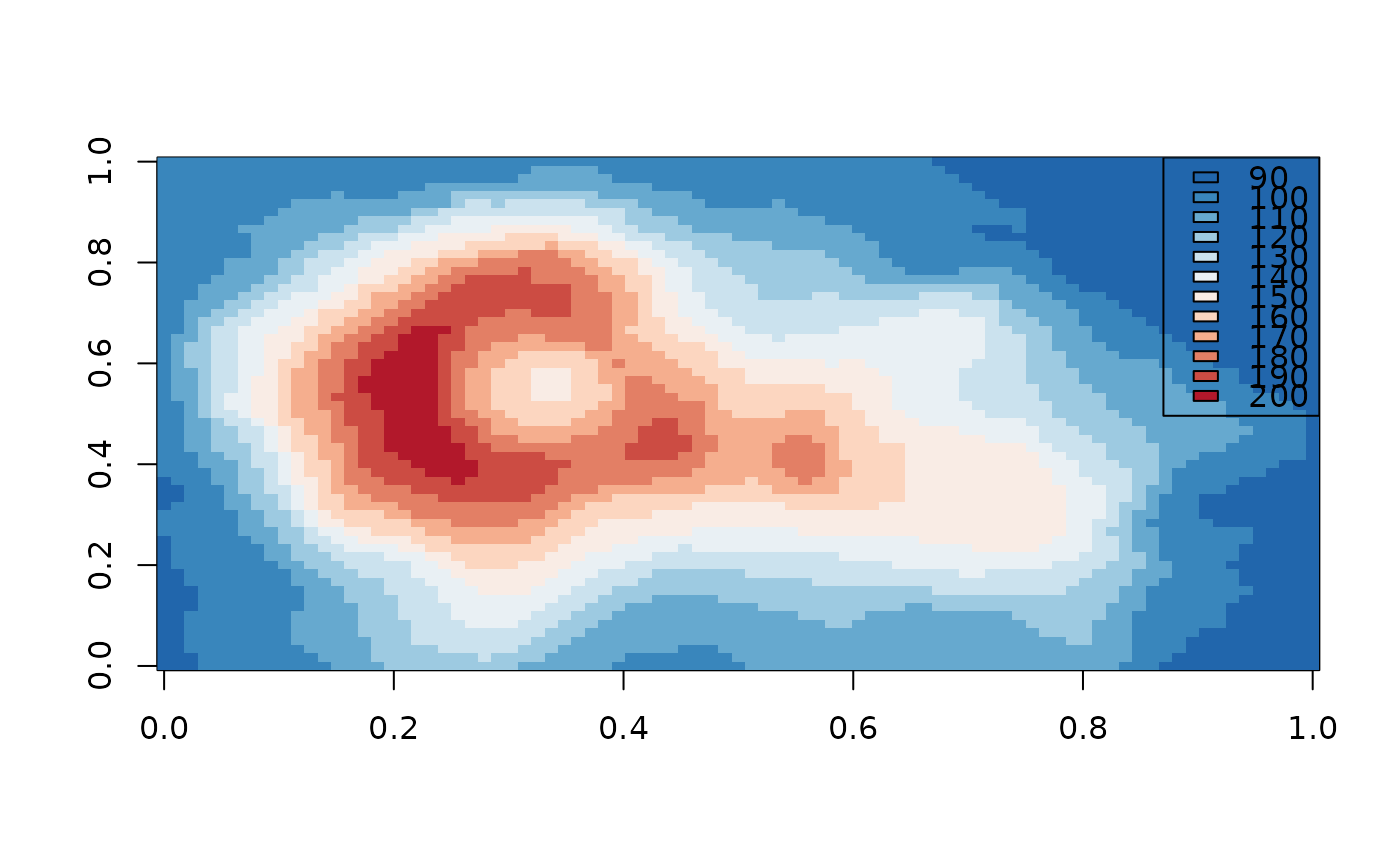
## Build palette functions
ramp_BuRd <- palette_color_picker("BuRd")
(col <- ramp_BuRd(elevation$breaks))
#> [1] "#2166AC" "#3986BC" "#66A9CF" "#9DCAE1" "#CBE2EE" "#E9F0F4" "#F9ECE5"
#> [8] "#FCD6C0" "#F5AE8E" "#E37F65" "#CC4C43" "#B2182B"
image(volcano, col = col)
legend("topright", legend = elevation$breaks, fill = col)
## Where are breaks?
elevation$breaks
#> [1] 90 100 110 120 130 140 150 160 170 180 190 200
## Build palette functions
ramp_BuRd <- palette_color_picker("BuRd")
(col <- ramp_BuRd(elevation$breaks))
#> [1] "#2166AC" "#3986BC" "#66A9CF" "#9DCAE1" "#CBE2EE" "#E9F0F4" "#F9ECE5"
#> [8] "#FCD6C0" "#F5AE8E" "#E37F65" "#CC4C43" "#B2182B"
image(volcano, col = col)
legend("topright", legend = elevation$breaks, fill = col)
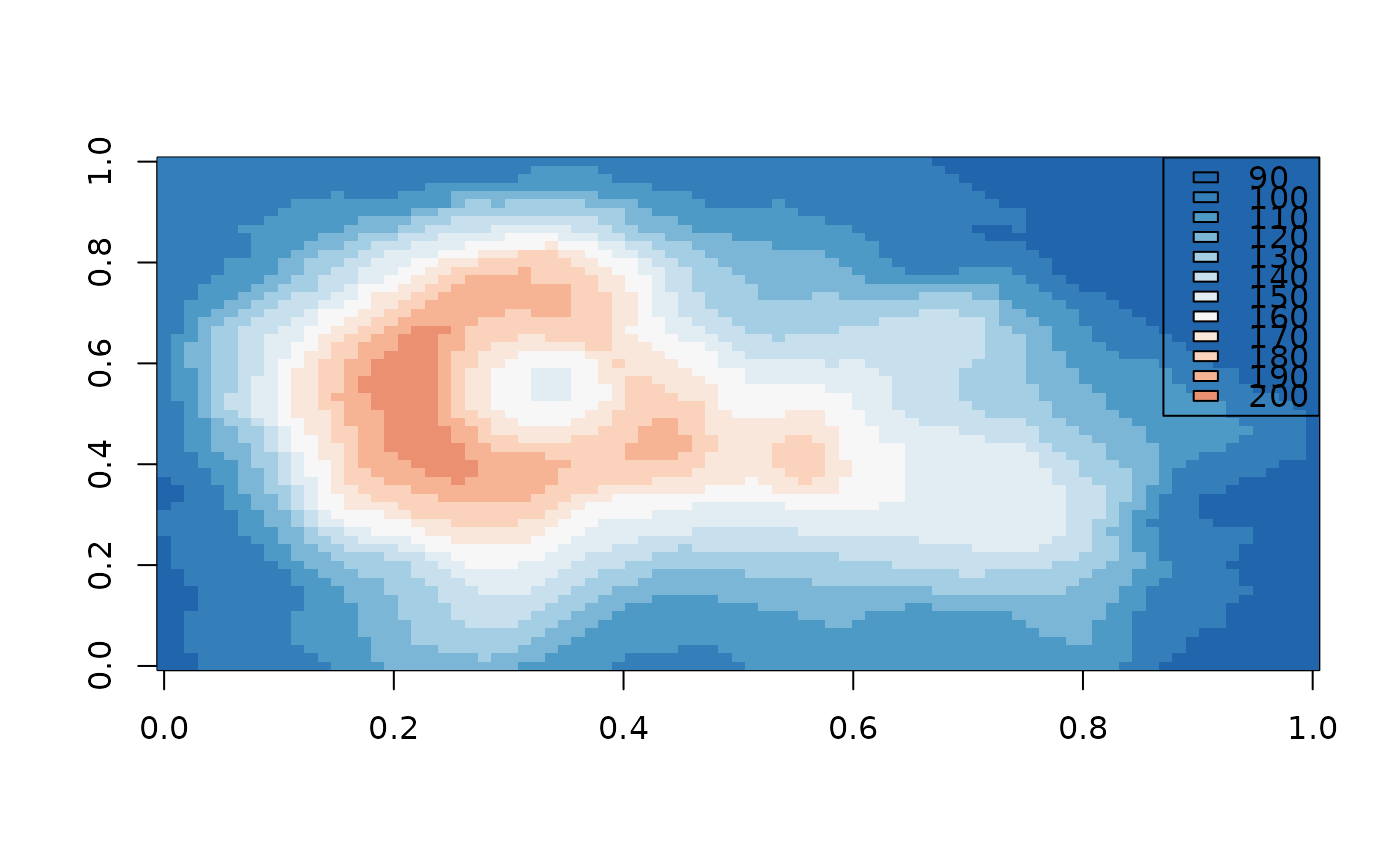
 ## Rescale to midpoint
ramp_BuRd <- palette_color_picker("BuRd", midpoint = 160)
(col <- ramp_BuRd(elevation$breaks))
#> [1] "#2166AC" "#347FB9" "#4E9AC6" "#7BB6D6" "#A3CEE3" "#C8E0ED" "#E1ECF3"
#> [8] "#F7F7F7" "#FAE7DB" "#FBD3BD" "#F6B495" "#EB9172"
image(volcano, col = col)
legend("topright", legend = elevation$breaks, fill = col)
## Rescale to midpoint
ramp_BuRd <- palette_color_picker("BuRd", midpoint = 160)
(col <- ramp_BuRd(elevation$breaks))
#> [1] "#2166AC" "#347FB9" "#4E9AC6" "#7BB6D6" "#A3CEE3" "#C8E0ED" "#E1ECF3"
#> [8] "#F7F7F7" "#FAE7DB" "#FBD3BD" "#F6B495" "#EB9172"
image(volcano, col = col)
legend("topright", legend = elevation$breaks, fill = col)